
1. Introduction
"Propedia is a database of protein-peptide complexes"
Propedia 26 is available at https://bioinfo.dcc.ufmg.br/propedia26
What is Propedia?
PROPEDIA is a database of peptide-protein complexes clusterized in three methodologies: based on peptide sequences; based on structure interface; and based on binding sites. PROPEDIA main goal is to give new insights into peptide design of biotechnological interests.
Propedia 26 stats
| pep-pro complexes | multipro | Total | |
|---|---|---|---|
| Unique entries | 38,218 | 0 | 38,218 |
| Duplicated entries | 35,174 | 19,759 | 54,933 |
| Total | 73,392 | 19,759 | 93,151 |
1.1 Overview
Propedia is a publicly accessible, curated database dedicated to protein-peptide interactions. It serves as a central repository for structural, thermodynamic, and functional data of complexes formed between proteins and peptide ligands. Derived from the Protein Data Bank (PDB), Propedia offers a robust platform for researchers in bioinformatics, structural biology, and drug discovery to explore, analyze, and derive insights from these critical molecular interactions.
Protein-peptide interactions are fundamental to numerous cellular processes, including signal transduction, immune response, and enzyme regulation. Understanding the principles that govern these interactions is crucial for deciphering biological mechanisms and developing novel therapeutics. Propedia addresses this need by providing a systematically organized and enriched dataset that goes beyond the raw structural data available in the PDB.
The database is equipped with a user-friendly web interface and powerful search tools, allowing users to query complexes by PDB ID, peptide sequence, protein sequence, specific interaction motifs, or thermodynamic parameters. Furthermore, Propedia integrates advanced analytical capabilities, such as multiple sequence alignment and clustering based on peptide similarity, enabling comparative studies and the identification of binding patterns.
Key Highlights:
- Curated Dataset: A comprehensive collection of protein-peptide complexes from the PDB, carefully validated and annotated.
- Dual Search Modes: Supports both text-based queries (e.g., PDB ID, UniProt ID) and sequence-based similarity searches (BLAST).
- Advanced Filtering: Enables refinement of results by experimental method, resolution, interaction energy, and more.
- Integrated Analysis Tools: Built-in tools for visualizing interfaces, aligning sequences, and clustering complexes.
- Open Access: All data is freely available for download, supporting reproducible research.
1.2 What's new in version 26
Propedia v26 introduces major updates that significantly expand the database and enhance its analytical power.
1.2.1 Expanded dataset
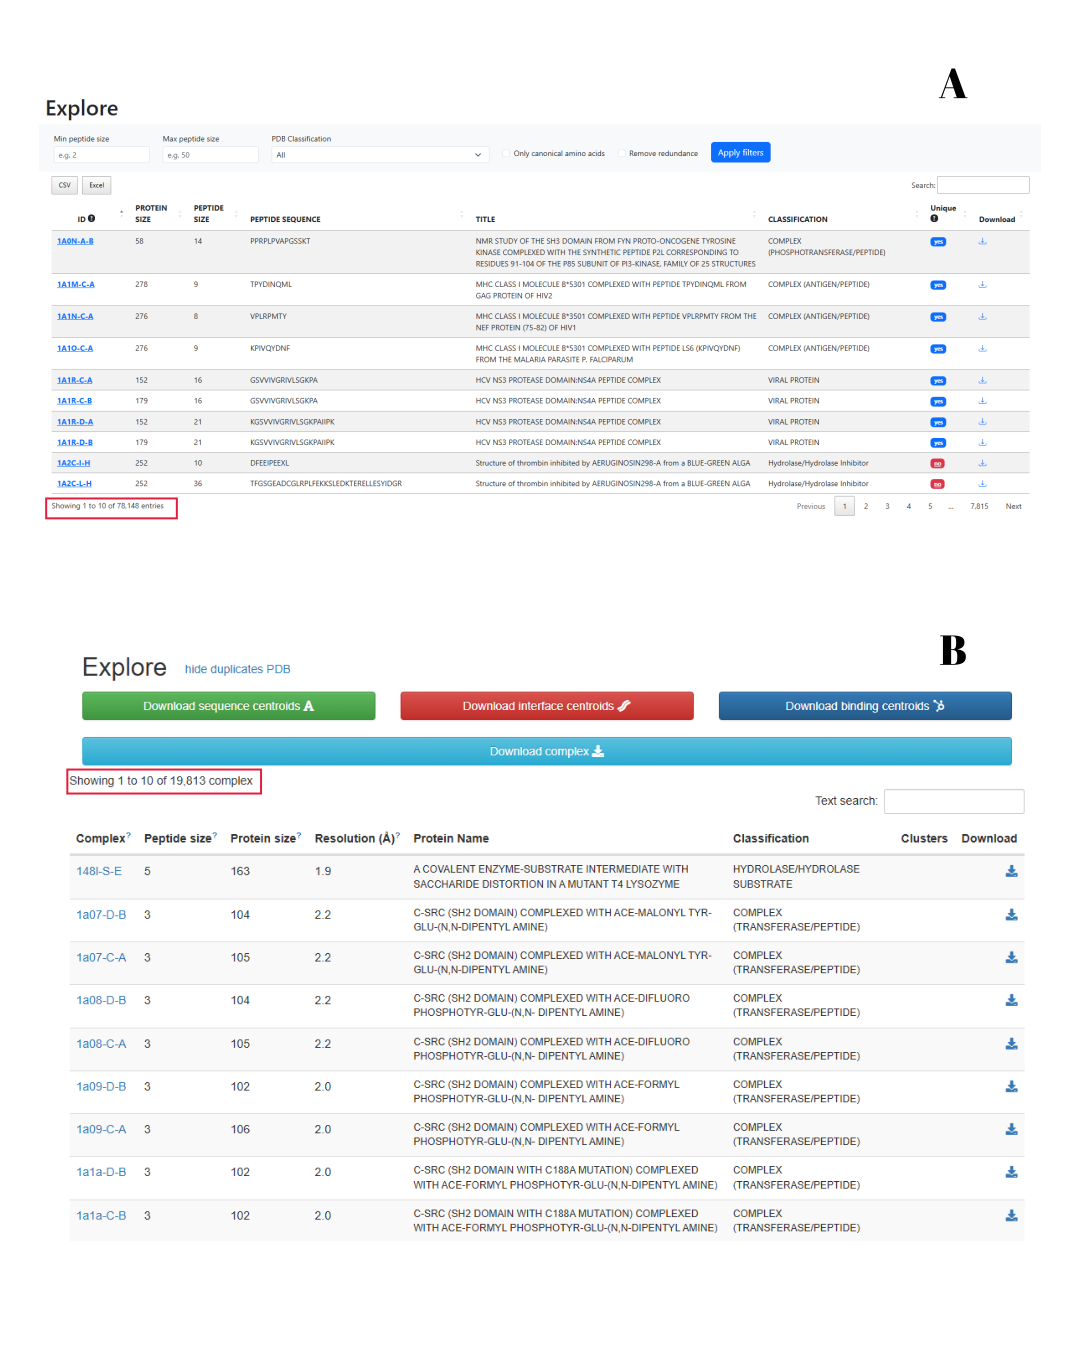
- Increased complex count: The updated version of Propedia now includes 73,392 protein-peptide complexes, a 3.7-fold increase in data coverage compared to the previous release (19,813 complexes), as shown in figure 1. Together with the 19,759 multipro entries, the database holds 93,151 entries in total.
- Updated PDB sources: Includes structures from the Protein Data Bank collected in September 2025 (the most recent structure was deposited on 18 July 2025), ensuring researchers have access to the most recent structural data.
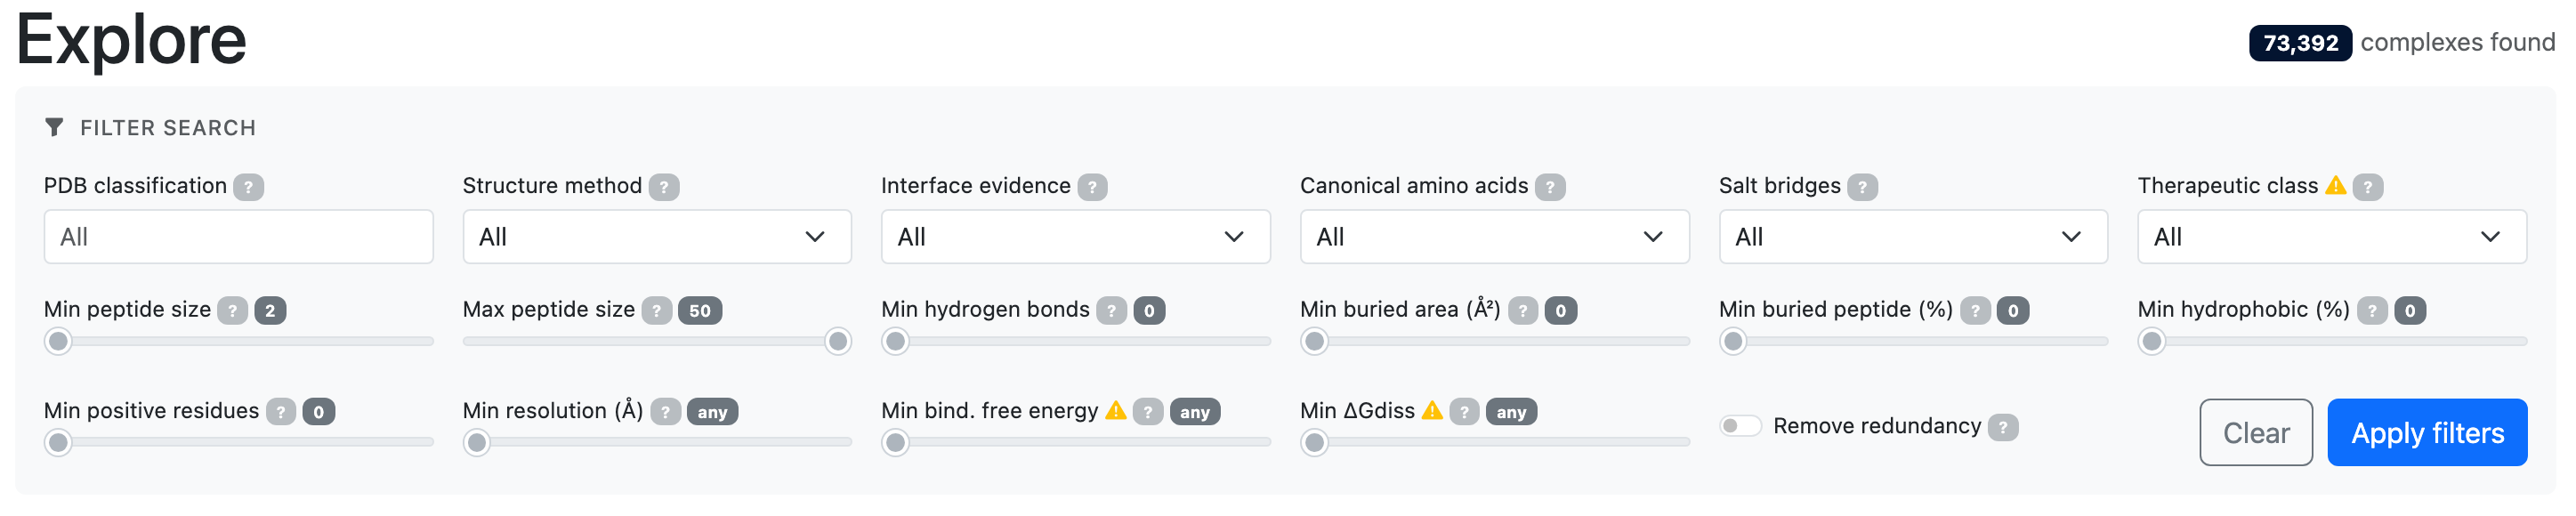
A dataset of this size is only useful if it can be narrowed down, so the growth in the number of complexes was accompanied by a new filter panel on the Explore page. Instead of searching by identifier alone, the user combines the properties that were computed for every complex — provenance (PDB classification, structure method, resolution), composition (peptide length, canonical amino acids), interface (evidence from PISA, hydrogen bonds, salt bridges, buried area, buried peptide, hydrophobicity, positive residues), energy (binding free energy, ΔGdiss) and predicted therapeutic class — and the counter reports how many complexes survive the selection before the table is redrawn. The redundancy switch reduces the result to one representative per cluster, which is the usual starting point for building a dataset. Figure 2 shows the panel; each filter is described in detail in section 2.5.
1.2.2 Redesigned user interface
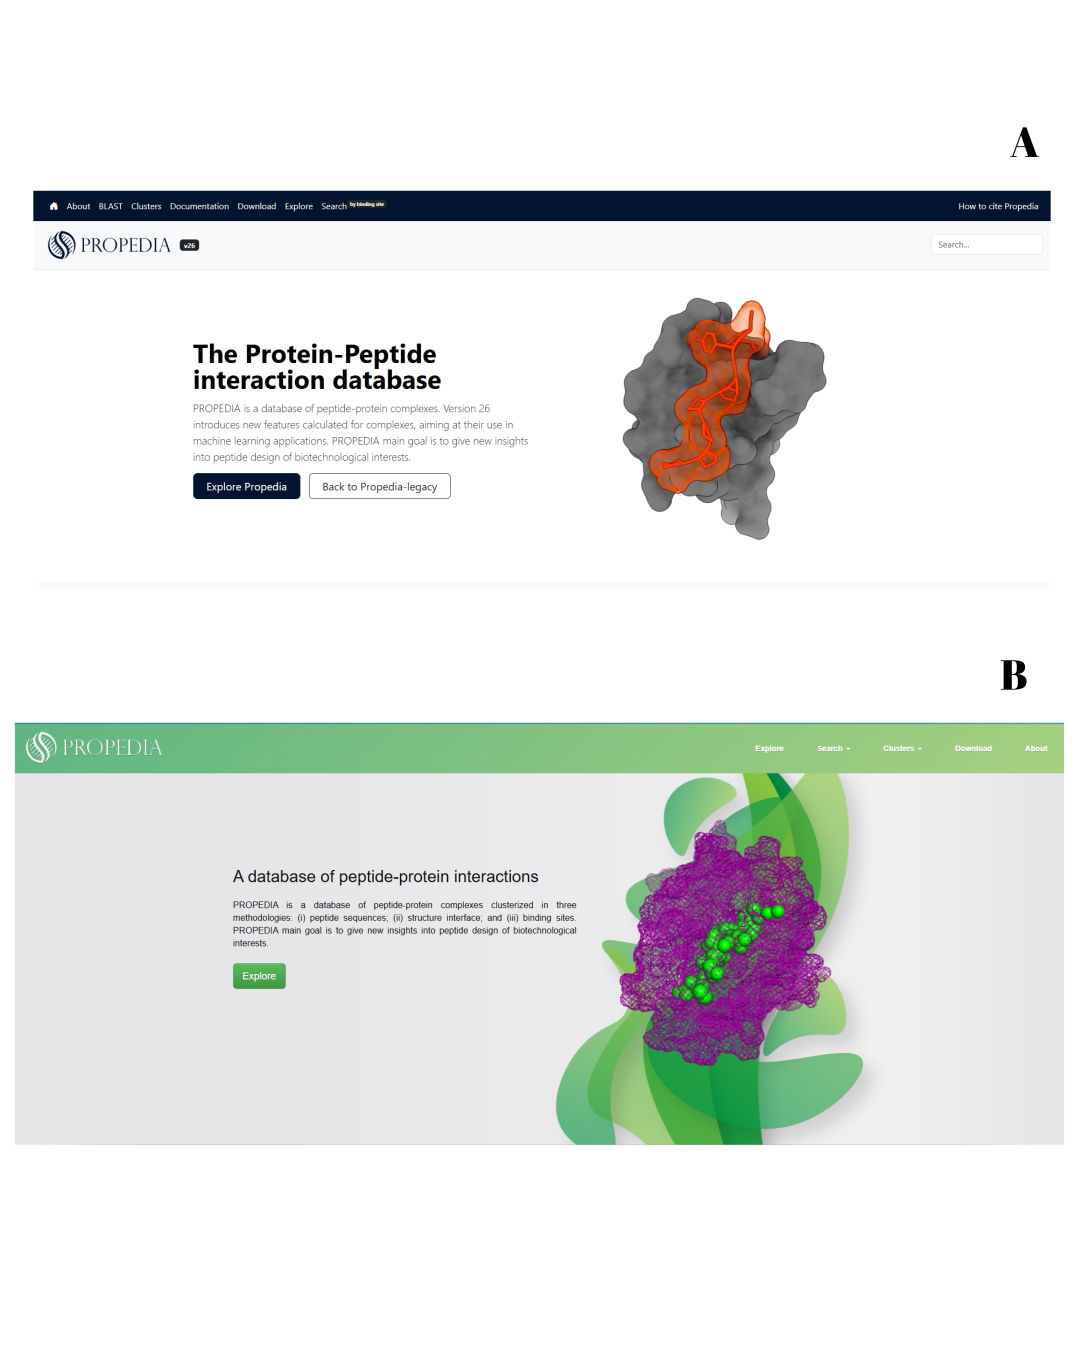
- Modernized layout: Complete visual overhaul with improved navigation and responsive design (Figure 3).
- Enhanced search page: More intuitive organization of search options and filters.
- Advanced results page: Redesigned results table with better sorting capabilities and immediate access to key complex information.
1.2.3 New analytical tools
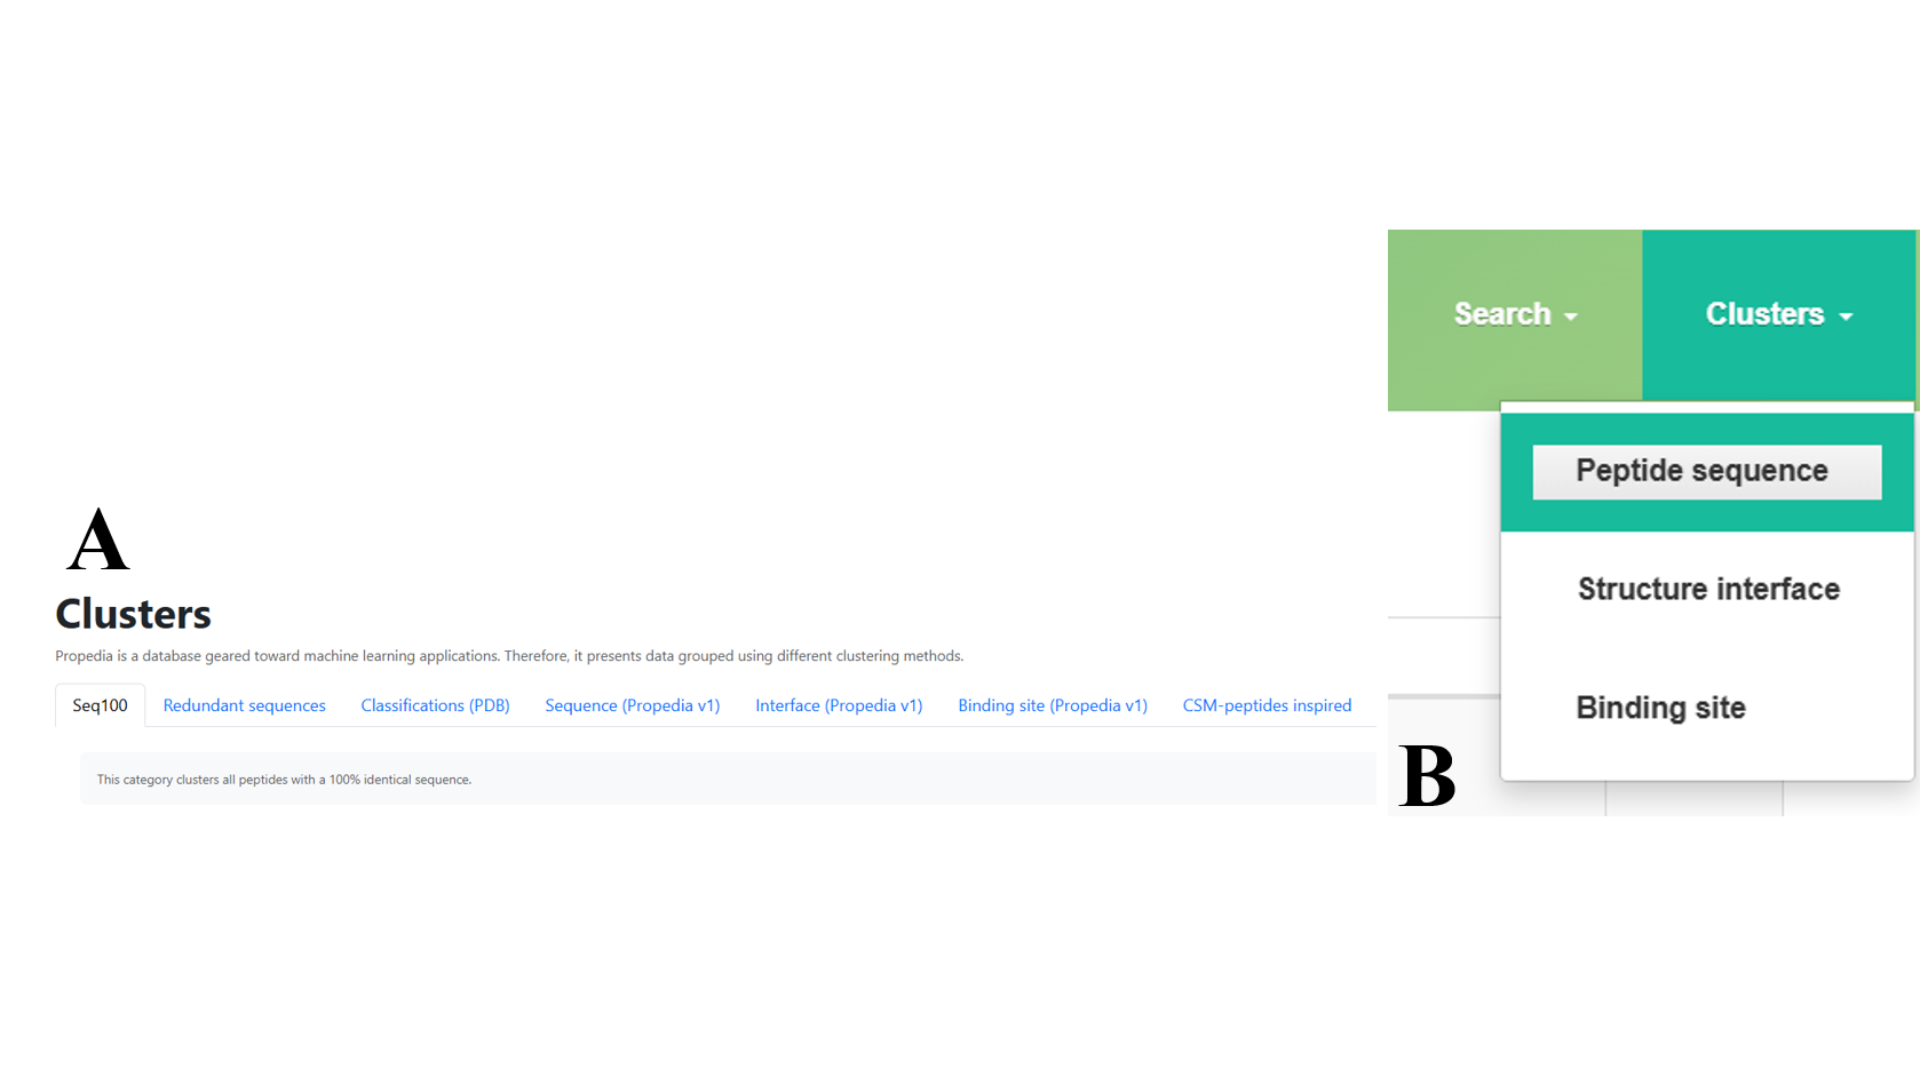
- Peptide clustering: Implementation of a novel peptide similarity clustering algorithm that groups complexes based on peptide sequence similarity, enabling evolutionary and functional analysis (Figure 4), more details in section 2.3 and 2.4.
- Interface properties from PISA: Each entry now reports the chemical and energetic properties of the interface calculated with PISA, including the Complexation Significance Score, the buried and dissociation areas, the dissociation free energy and the solvation energy gain, more details in section 2.1.5.
1.2.4 Improved search capabilities
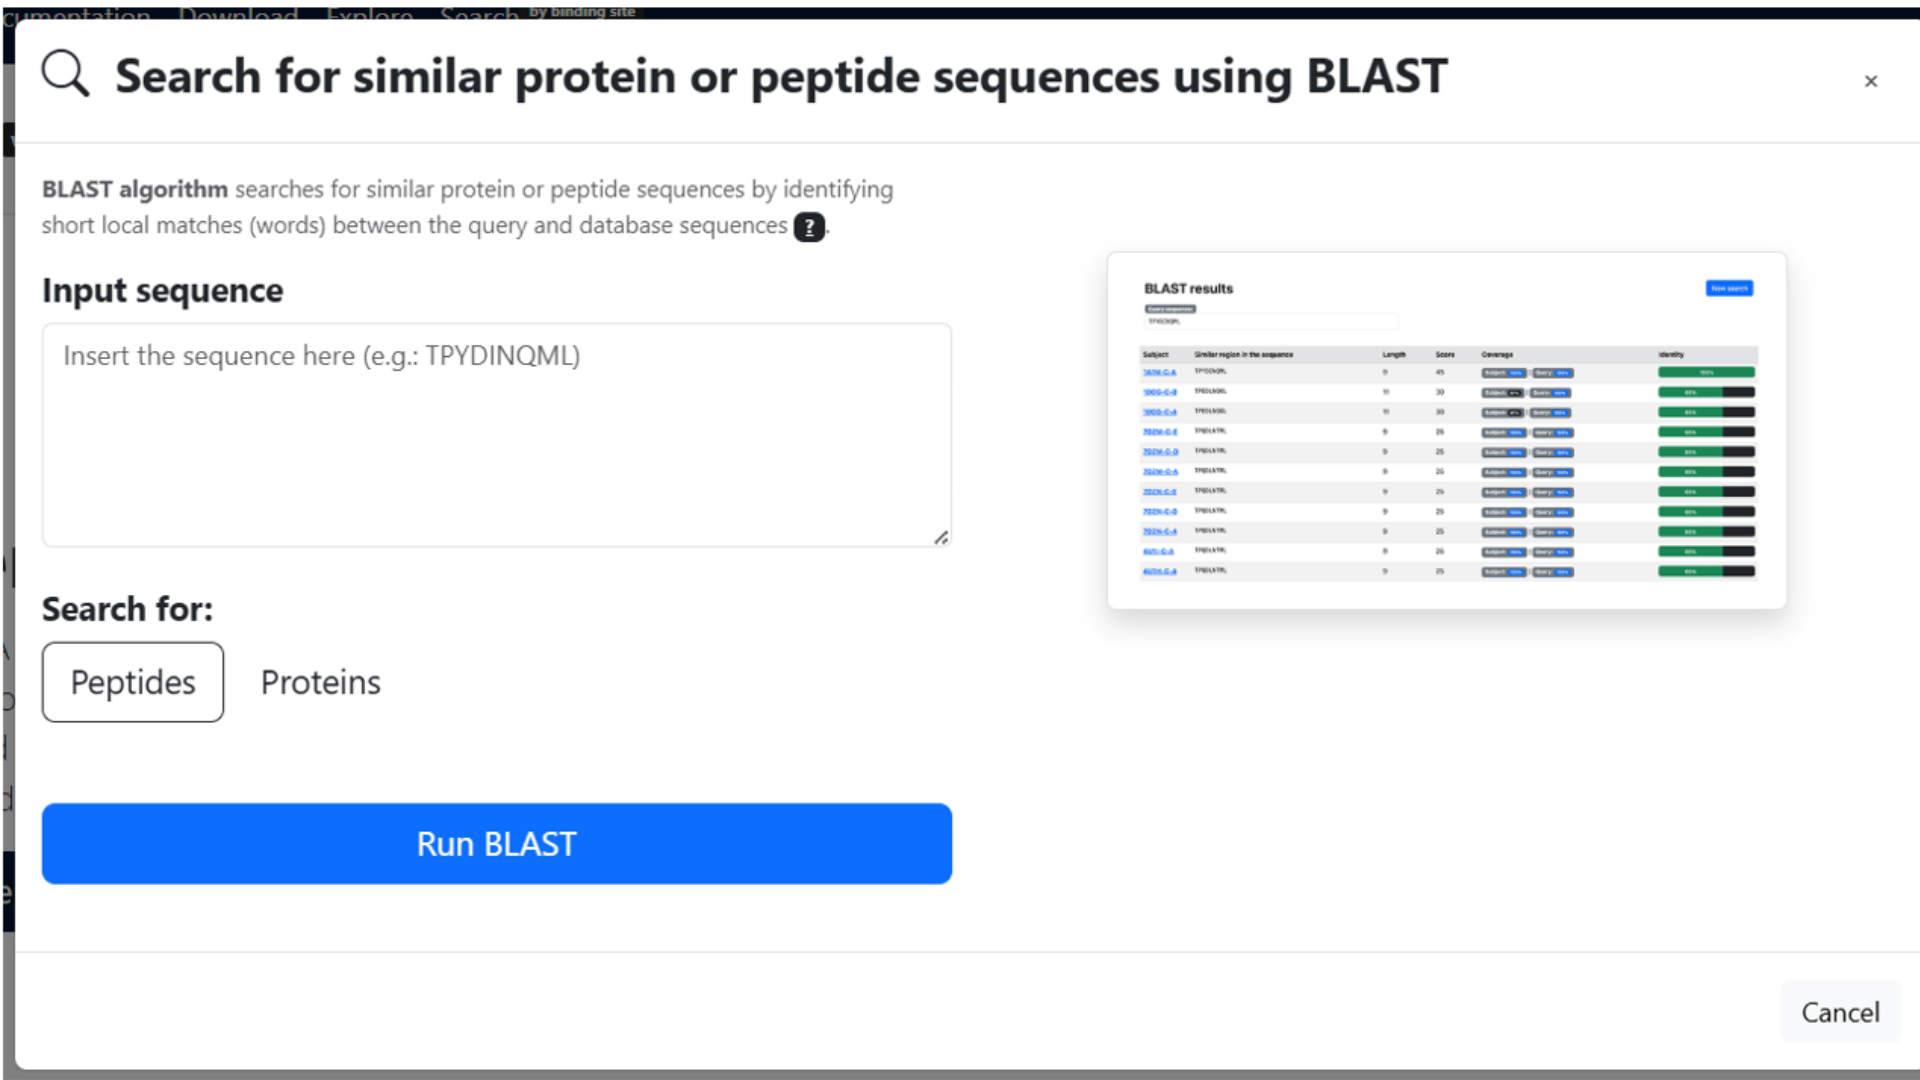
- BLAST Search: Updated sequence search with better performance and more configurable parameters (Figure 5).
1.2.5 Technical improvements
In version 26, the complex details page has been extensively redesigned to offer a much deeper interaction analysis: it now displays atomic data with precise distance measurements and clear categorization of interaction types (hydrogen bonds, hydrophobic contacts, etc.). In addition, complete structural metrics, such as interface area and interaction energy, which were previously absent or very basic, have been incorporated. The presentation of the data has also been reorganized: in v26, the information is distributed across tabs (structure, energy, sequence) for greater clarity; in the old version, everything was on a single page with less organization. From a computational standpoint, energy calculations have been improved with updated algorithms (e.g., NACCESS or equivalents) with more refined parameterization, while the previous version applied basic calculations with limited validation. These topics are shown in Table 1, and they will be discussed in more detail in the following sections.
| Property | Propedia-legacy | Propedia v26 |
|---|---|---|
| Description Box | ||
| PDB Title | Yes | Updated for PDB ID |
| Resolution (Å) | Yes | Yes |
| Classification | Yes | Updated for “Description” |
| Download the complex (PDB file) | Yes | Yes |
| Download contacts | No | Yes |
| Download complex data | No | Yes |
| Structure method | No | Yes |
| Peptide chain | No | Yes |
| Protein chain | No | Yes |
| Peptide length | No | Yes |
| Protein length | No | Yes |
| Links to UniProt, PDB, and PubMed | Yes | Yes |
| Physical-chemical parameters - Protein/peptide Box | ||
| Description | Yes | Yes |
| Organism | Yes | No |
| Chain | Yes | Yes |
| Length | Yes | Yes |
| Binding Area (Ų) | Yes | Yes* (in a new panel) |
| Molecular Weight | Yes | Yes |
| Aromaticity | Yes | No |
| Instability | Yes | Yes |
| Isoelectric Point | Yes | Yes |
| Sequence | Yes | Yes |
| Aliphatic Index | No | Yes |
| GRAVY | No | Yes |
| Hydrophobic (%) | No | Yes |
| Positive Residues | No | Yes |
| Negative Residues | No | Yes |
| Atomic Formula | No | Yes |
| Total Atoms | No | Yes |
| Extinction Coeff. (with disulfide) | No | Yes |
| Extinction Coeff. (no disulfide) | No | Yes |
| Clustering Classification Box | ||
| Sequence cluster | Yes | Yes |
| Contact cluster | Yes | Yes |
| Interface cluster | Yes | Yes |
| Unique complex | No | Yes |
| Similar complex | No | Yes |
| Similar peptides | No | Yes |
| PDB classification | Yes | Yes |
| CSM-peptides classes | ||
| Anti-Angiogenic (AAP) | No | Yes |
| Anti-Bacterial (ABP) | No | Yes |
| Anti-Cancer (ACP) | No | Yes |
| Anti-Inflammatory (AIP) | No | Yes |
| Quorum Sensing (QSP) | No | Yes |
| Surface Binding (SBP) | No | Yes |
| Protein-peptide interactions Box | ||
| ASA Complex (Naccess) | No | Yes |
| ASA (protein) | No | Yes |
| ASA (peptide) | No | Yes |
| BProA | No | Yes |
| BPepA | No | Yes |
| BPP% | No | Yes |
| BSA | No | Yes |
| Interaction energy (Prodigy) | ||
| Number of intermolecular contacts | No | Yes |
| Charged–charged contacts | No | Yes |
| Charged–polar contacts | No | Yes |
| Charged–apolar contacts | No | Yes |
| Polar–polar contacts | No | Yes |
| Apolar–polar contacts | No | Yes |
| Apolar–apolar contacts | No | Yes |
| Percentage of apolar NIS residues | No | Yes |
| Percentage of charged NIS residues | No | Yes |
| Predicted binding affinity (kcal·mol⁻¹) | No | Yes |
| Predicted dissociation constant (M) at 25°C | No | Yes |
| Interface residues (distmax ≤ 6 Å) | No | Yes |
| Contacts (Calculated using COCaDA) | No | Yes |
| Interface properties (PISA) | ||
| Interface evidence (strong / moderate / weak) | No | Yes |
| Complexation significance score (CSS) | No | Yes |
| Interface area (Ų) | No | Yes |
| Buried area, peptide and protein (Ų) | No | Yes |
| Total buried area (Ų) | No | Yes |
| Complex ASA (Ų) | No | Yes |
| Dissociation area (Ų) | No | Yes |
| Dissociation free energy ΔGdiss (kcal·mol⁻¹) | No | Yes |
| Solvation energy gain ΔiG (kcal·mol⁻¹) | No | Yes |
| ΔiG P-value | No | Yes |
| Solvation energy, peptide and protein (kcal·mol⁻¹) | No | Yes |
| Total interaction energy ΔiG (kcal·mol⁻¹) | No | Yes |
| Dissociation entropy TΔS (kcal·mol⁻¹) | No | Yes |
| Hydrogen bonds and salt bridges at the interface | No | Yes |
| Interface residues, peptide and protein | No | Yes |
| Interface atoms, peptide and protein | No | Yes |
1.3 How to Cite & Licenses
To cite PROPEDIA, we recommend referencing both the original article and the most recent publication in the database. If specific features or previous versions are used, the respective publications may also be cited. The original 2021 article presents the first description of the database:
Martins, P.M., Santos, L.H., Mariano, D. et al. Propedia: a database for protein–peptide identification based on a hybrid clustering algorithm. BMC Bioinformatics 22, 1 (2021). doi: 10.1186/s12859-020-03881-z.
Version 2.3, published in 2023, introduces a new representation approach based on structural signatures:
Martins P, Mariano D, Carvalho FC, Bastos LL, Moraes L, Paixão V, and docs-cardoso de Melo-Minardi R (2023). Propedia v2.3: A novel representation approach for the peptide-protein interaction database using graph-based structural signatures. Front. Bioinform. 3:1103103. doi: 10.3389/fbinf.2023.1103103.
An article for Propedia v26 is currently under development.
1.3.1 License: CC-BY ND 4.0
Propedia v26 data is available under the Creative Commons Attribution 4.0 International (CC BY ND 4.0) license. This license allows:
- Unrestricted use, including commercial use.
- Sharing and redistribution of the material in any format.
- Reproduction in any medium.
Requirements to use the material:
- Give appropriate credit to the original authors (cite the articles).
- Include a link to the license.
- Indicate if changes have been made.
- Cite the papers.
Exceptions
- Images or third-party materials included in the article may have specific credits or restrictions.
- Content not covered by CC BY 4.0 requires permission from the rights holder.
You can use the Propedia data freely in your research, but there is a restriction if you wish to create a competing database.
The code is available on GitHub and is shared under an MIT license.
1.3.2 Software policy: LBS-SRC
Propedia follows the LBS-SRC Software Policy, the academic software release cycle adopted by the Laboratory of Bioinformatics and Systems (LBS) of the Federal University of Minas Gerais (UFMG), Brazil, and by its partner groups. The policy defines the support period, the license, the versioning scheme and the authorship of every tool produced in the laboratory.
Support cycle. Each tool has a five-year life cycle counted from the publication date of the paper associated with it:
- Full support (first two years): provided by the developers of the tool and the co-authors of the paper. It covers security fixes, bug fixes, interface changes and general user support.
- Extended support (following three years): provided mainly by the LBS IT team, and it may not involve the original developers. It is limited to keeping the tool available and accessible; fixes to the results produced by the tool, new features and methodological changes are not covered.
More significant changes require a new version, and the support period is renewed from the publication of the paper associated with it. A new major version must not be created during the full support period of the previous one, and a new publication must be justified by new features or substantial changes to the tool, never by a data update alone.
License. Except where expressly stated otherwise, software produced by the LBS is released as open source under the MIT license, and documentation and supplementary materials under the Creative Commons Attribution 4.0 International (CC BY 4.0) license. The Propedia data follow the license described in section 1.3.1.
Versioning. Version numbers follow the pattern X.YY.MMDD, where X is the major version associated with the published paper, YY is the last two digits of the year, MM the month without a leading zero and DD the day with two digits. Versions 0.YY.MMDD are development versions (alpha and beta); after the publication of the paper the major version becomes 1, and it is only incremented when a new paper directly related to the tool is published. When an update changes only the data, X stays the same and just the YY.MMDD part is updated.
Authorship and ownership. The software trademark is attributed to the LBS, UFMG, Brazil. Ownership of each published version belongs, in order, to the first author of that version (or equally to the group of authors credited with the same level of contribution), to the project supervisor identified as the last author, and to the remaining collaborating authors — so different versions may have different ownership. Each version must carry the LBS-SRC license and the corresponding copyright notices, preserving the year of creation, the name of the software and the laboratory, followed by the notice of the current version:
          © 2020 PROPEDIA | LBS, UFMG (Brazil)

          © 2026 PROPEDIA v26 | Diego Mariano et al.
New versions may be developed by other research groups, provided they are expressly authorised by the last author (project supervisor).
2. How to use the platform
Propedia v26 can be accessed directly through the official website at:
Upon accessing the home page, users will find an intuitive navigation panel that allows them to quickly explore the database's main features, including complex search, structural visualization, interaction analysis, and download tools.
The initial interface features a top navigation bar that directs users to the Home, About, Browse, Clusters, Downloads, and Help pages. In addition, there is a quick search field that allows users to search for PDB IDs, peptides, or proteins directly.
The page also includes a highlights panel with information on new features and updates in version 26. These details are shown in the Figure below.
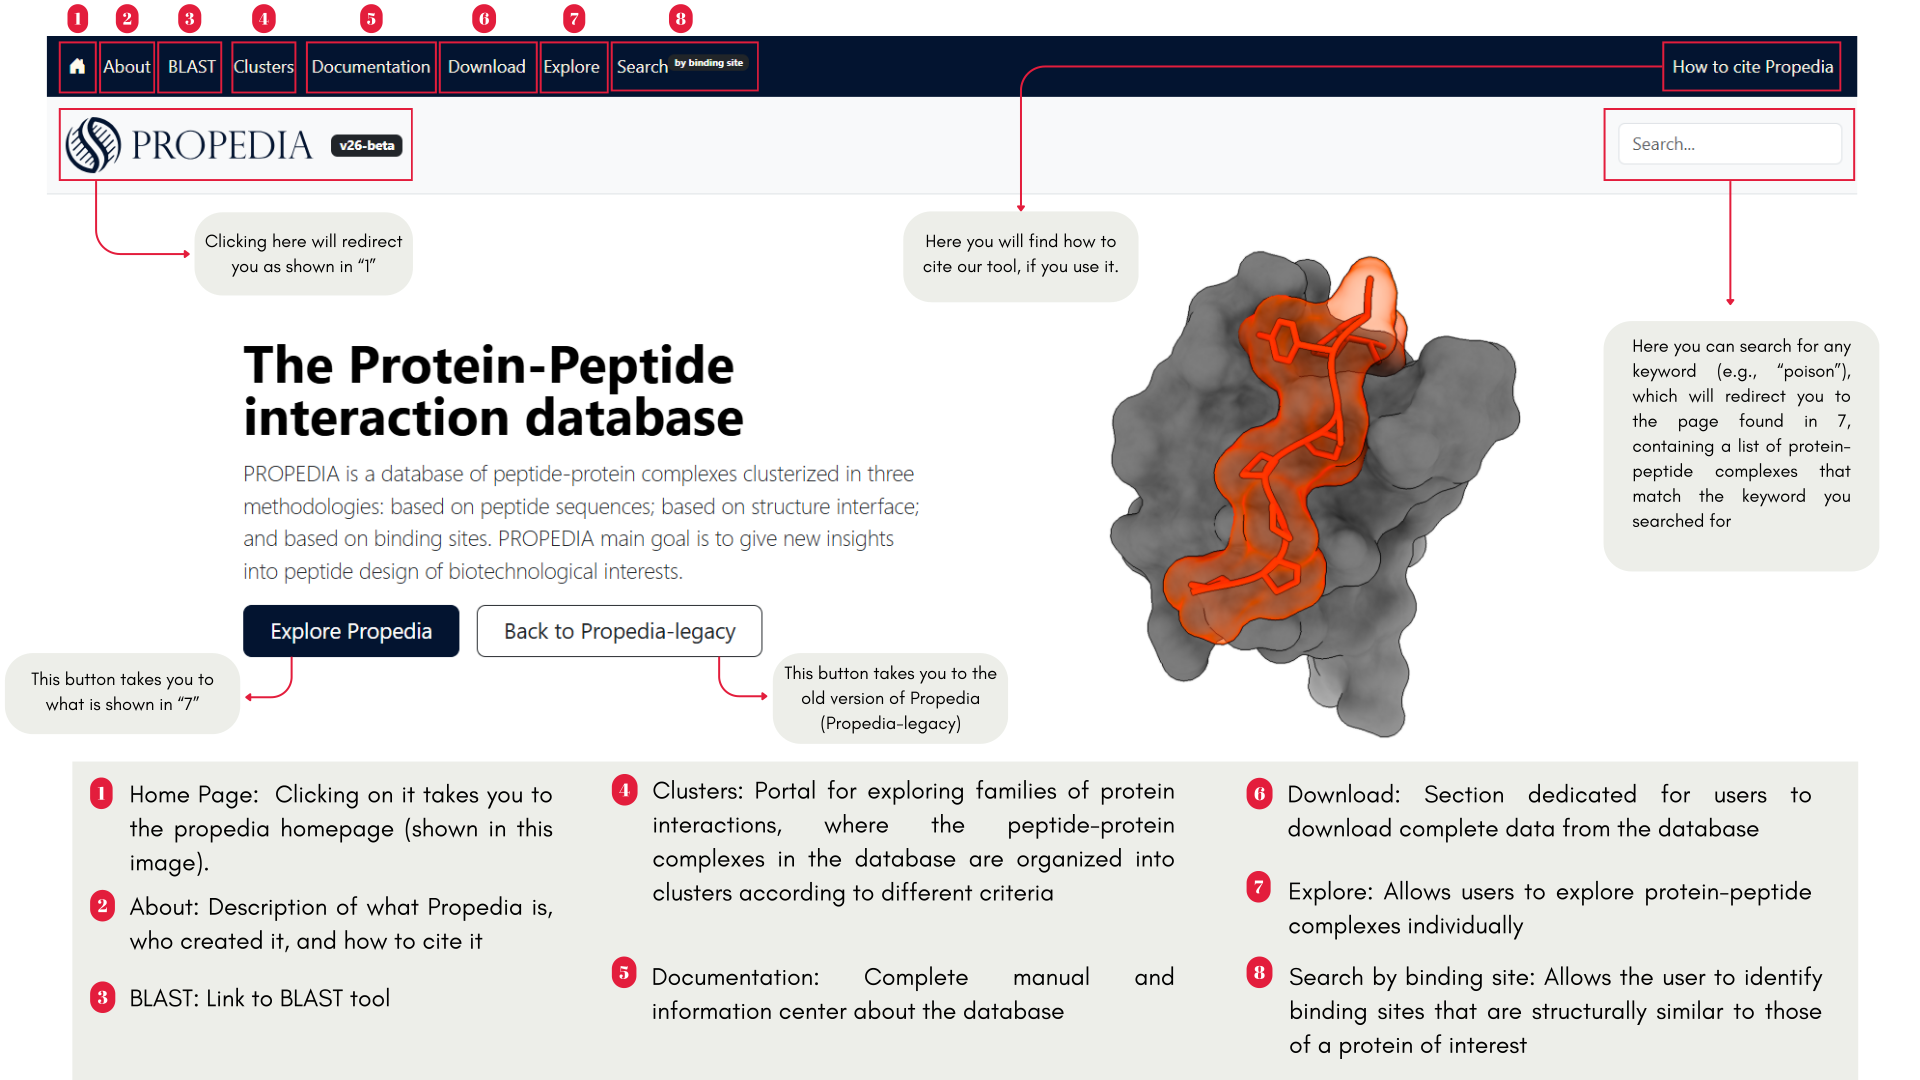
In addition, the home page features a highlights/statistics panel that displays, in a visual and objective manner, the main figures from the database, such as the number of complexes available, the number of clusters, and the total size of the database. This section gives users an immediate sense of the scale and information value of Propedia, enabling them to understand the repository's magnitude on their first visit. The page features a section dedicated to the credibility and authorship of the project, which identifies the developers responsible for Propedia. In a further step, the page includes an area dedicated to use cases and practical examples, illustrating how the user can search using an input code. Users can enter the code for a protein-peptide complex, also known as a “Propedia code” (e.g., 1WRZ-B-A, where the first four characters correspond to the PDB code, the fifth character corresponds to the peptide chain, and the sixth character corresponds to the protein chain) or a multipro (e.g., 1MT1-A), which does not specify the protein chain.
At the bottom of the page, institutional support and funding sources linked to the development of Propedia are also indicated, such as the Bioinformatics and Systems Laboratory (LBS), the Department of Computer Science (DCC), and the Federal University of Minas Gerais (UFMG), reinforcing the transparency and academic origin of the platform.
2.1 Entry page
In Propedia 26, each complex formed by the protein-peptide pair has an entry page. The entry page interface is divided into five parts:
- Entry description: Contains information extracted from the PDB.
- Physicochemical parameters: Contains predicted information using ProtParam.
- Interactive 3D structure visualization panel: Enables analysis of the complex's 3D structure.
- Clustering information: Contains similar structures based on various methods, such as sequence identity, structural alignment, prediction using machine learning models, and classes extracted from Propedia v1.
- Protein-peptide interaction information: Contains predicted information of the complex, such as interaction surface (predicted with NACCESS), binding energy (predicted with Prodigy), and interface residues and contacts (predicted with COCaDA).
2.1.1 Entry description
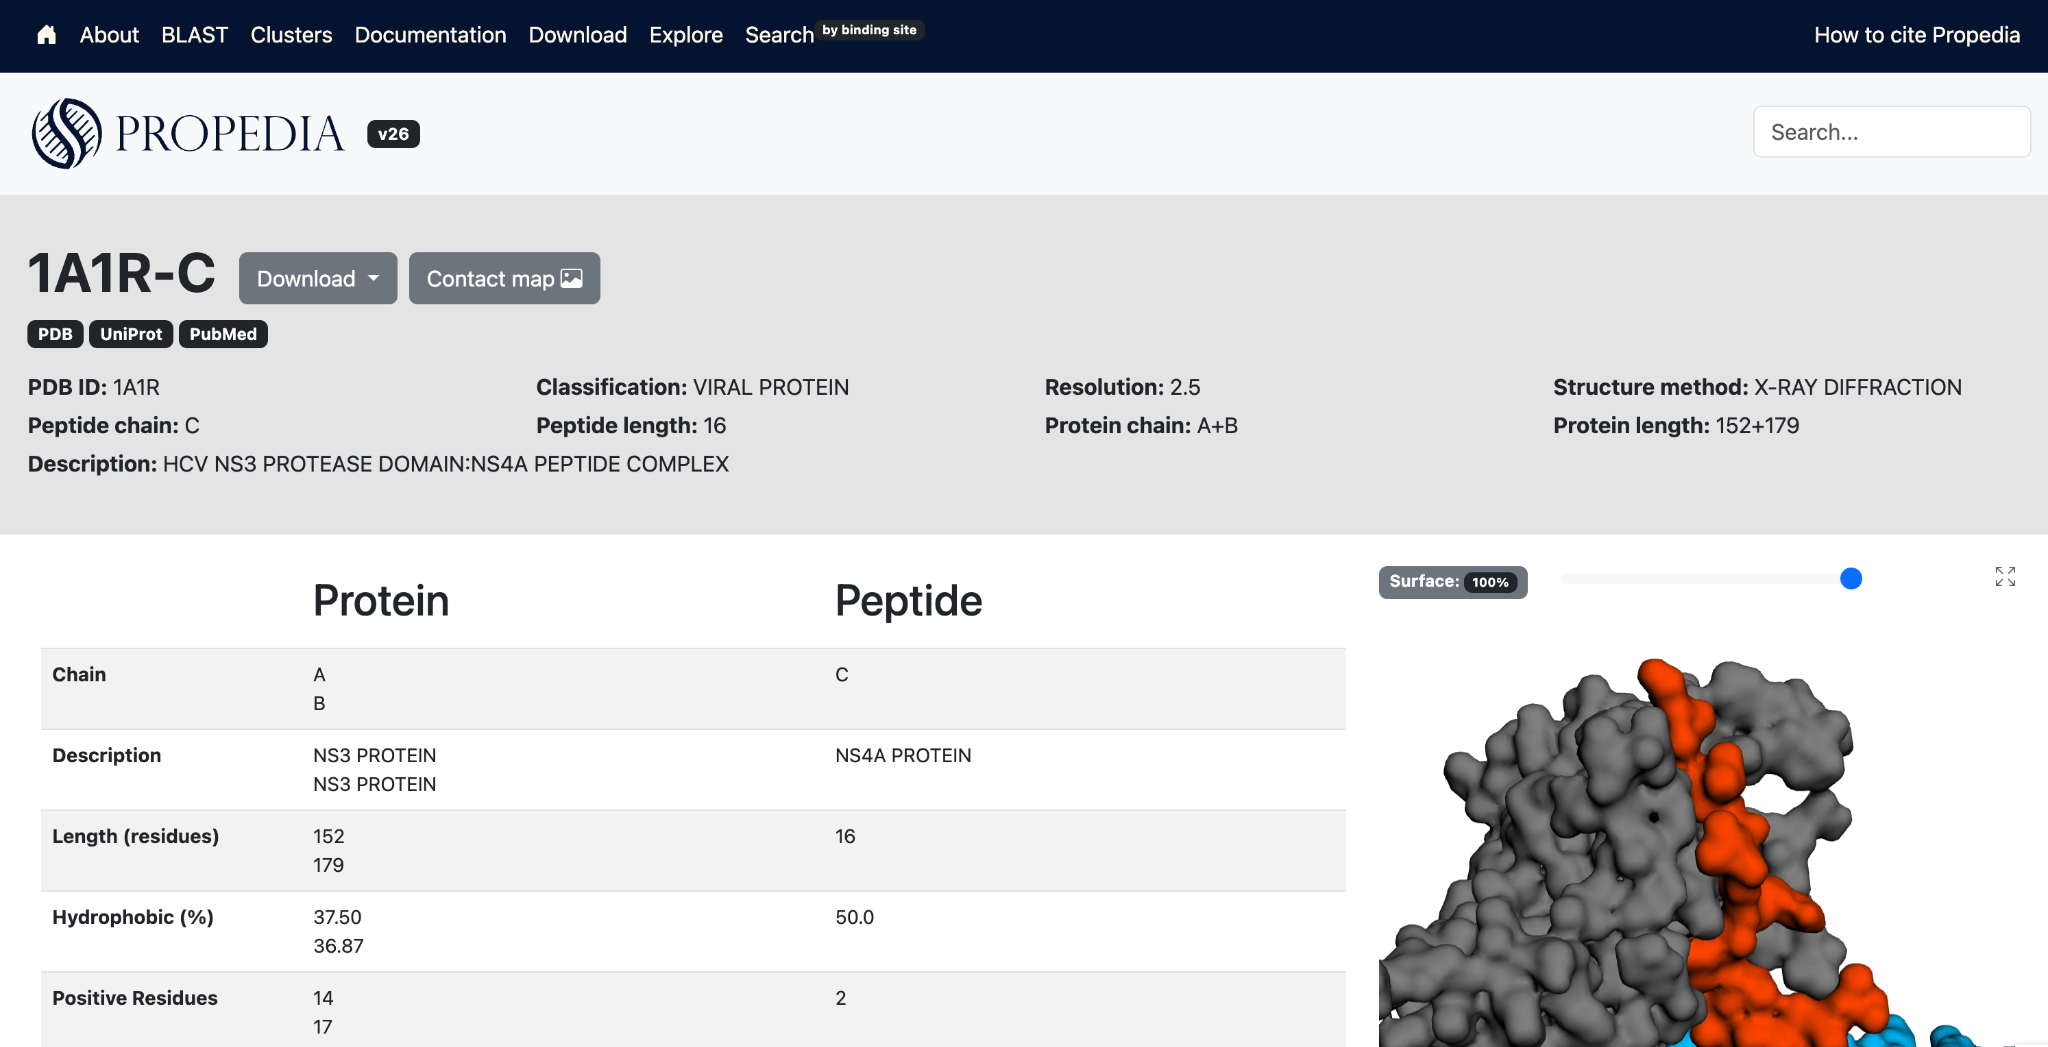
Contains information extracted from the PDB file, including PDB ID, structure method, resolution, complex, peptide chain, peptide length, protein chain, protein length, and PDB title (description).

The "complex" field contains a link to the multipro page. Peptides that interact with more than one protein chain have an entry in Propedia multipro. A Propedia multipro entry has a 6-character ID: the PDB ID followed by "-" and the peptide chain ID (e.g., 1A1R-C). Information on protein chains complexed to this peptide can be found in the main table on each Propedia multipro entry page.
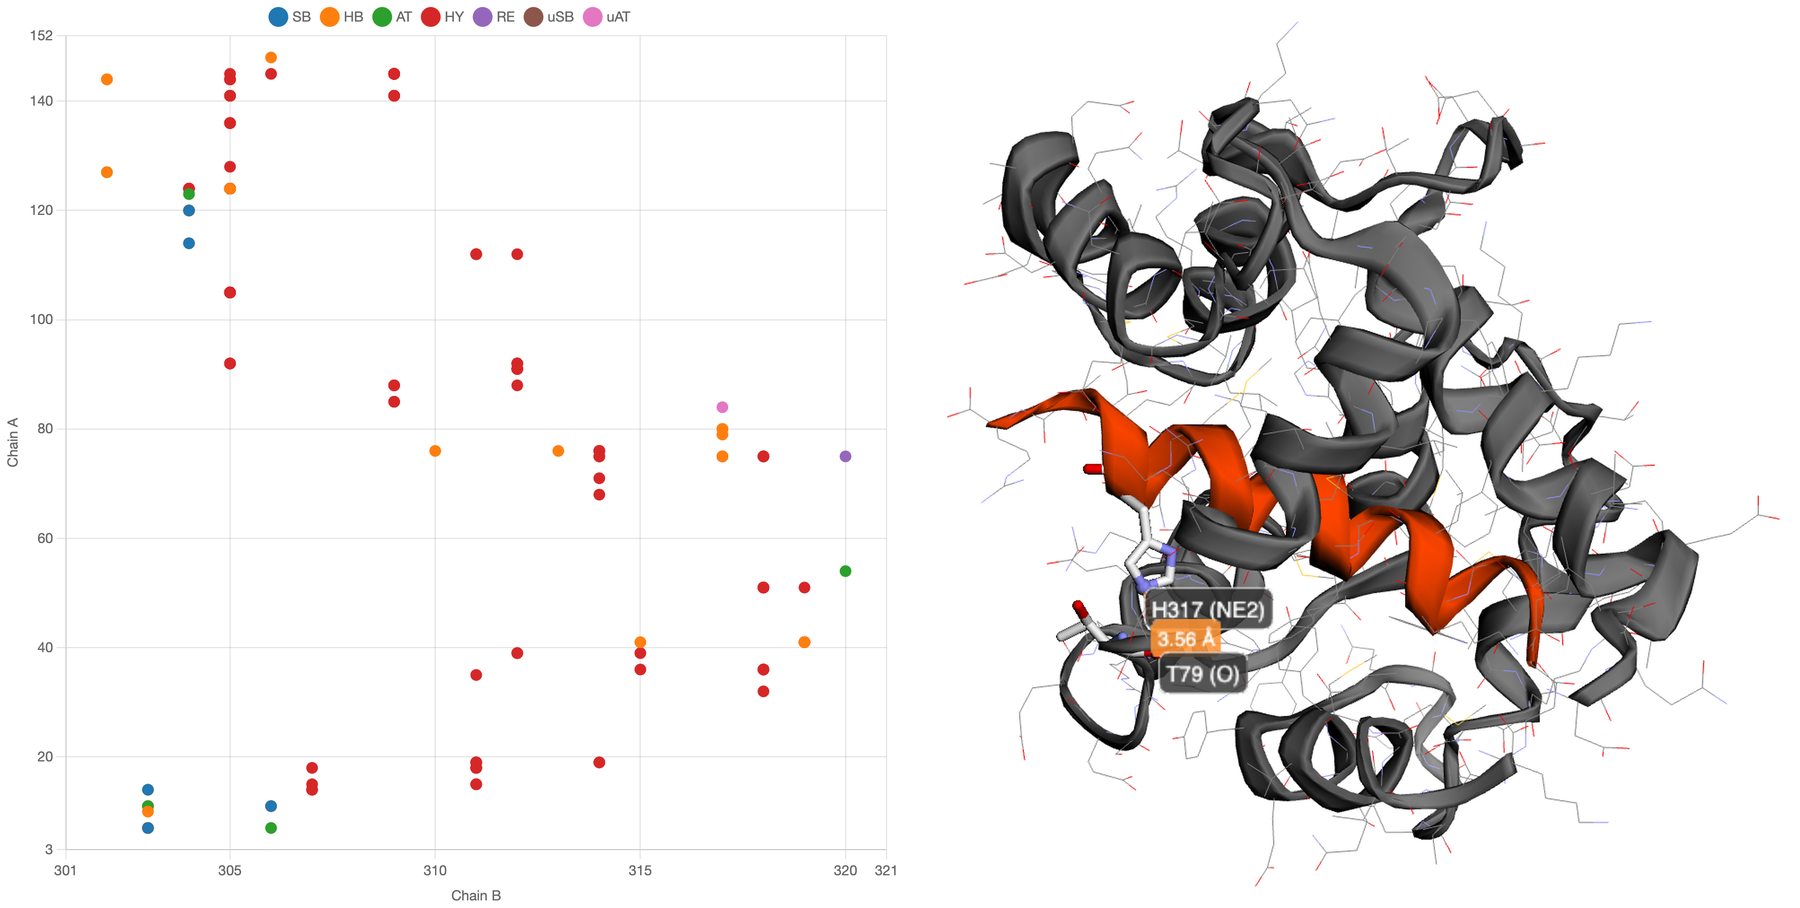
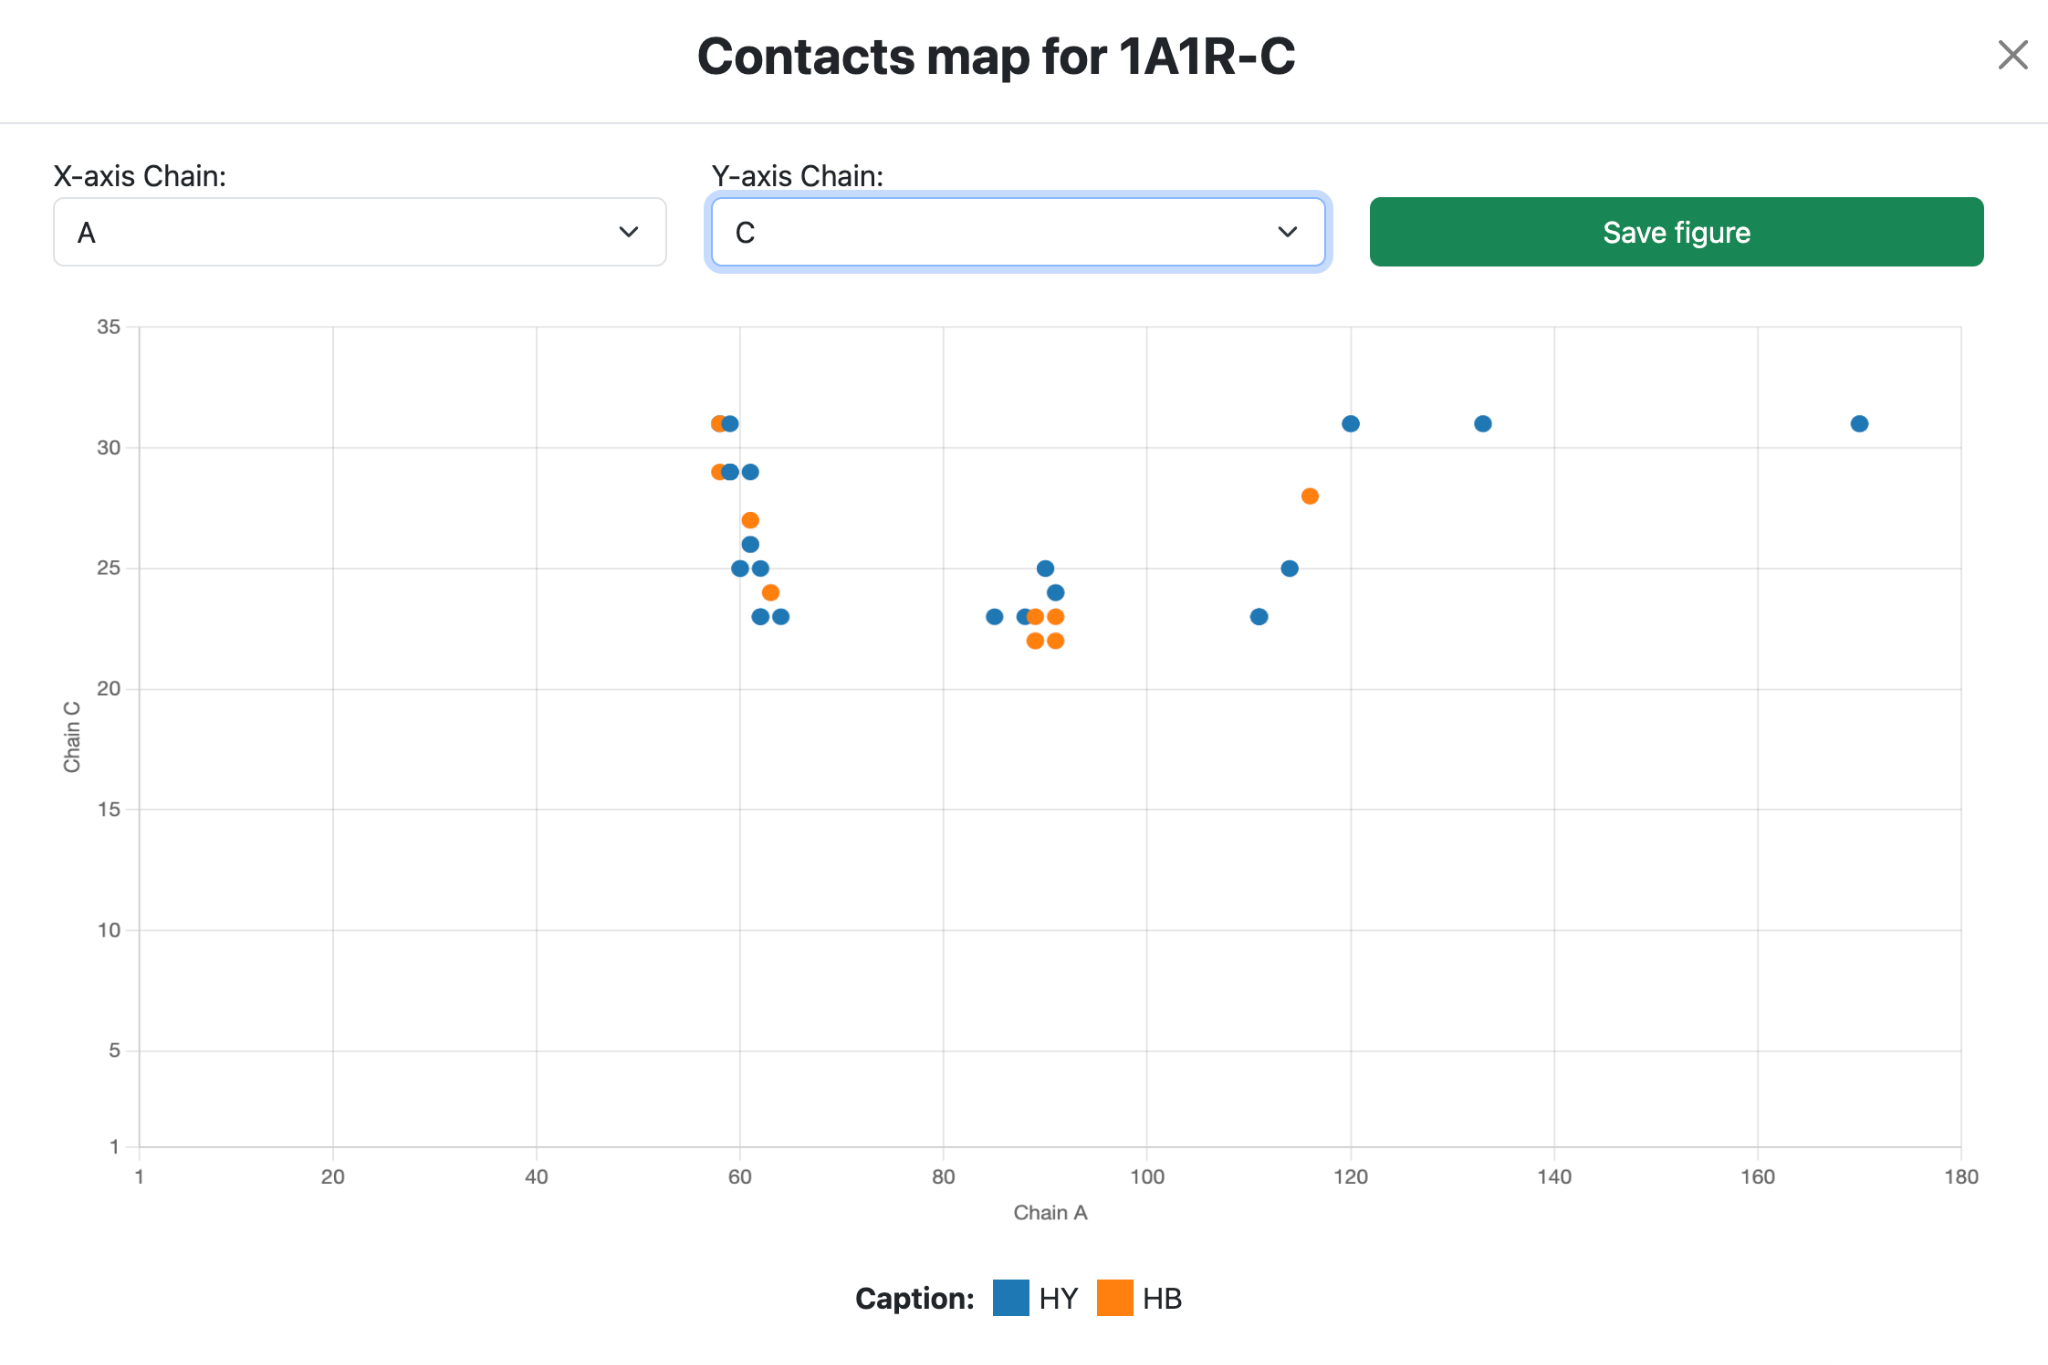
The contact map button displays a contact map for each pair of chains in the complex. It is shown on both the individual page for each entry and the multipro page. The charts are generated using the chart.js library, and the contacts are calculated using the COCaDA-CLI tool.
The download button allows you to download the input data, as well as the predicted contacts and structures. To obtain structural signatures, calculated using aCSM, and sequence signatures, calculated using iFeature, go to the "Download" page.
2.1.2 Physicochemical parameters
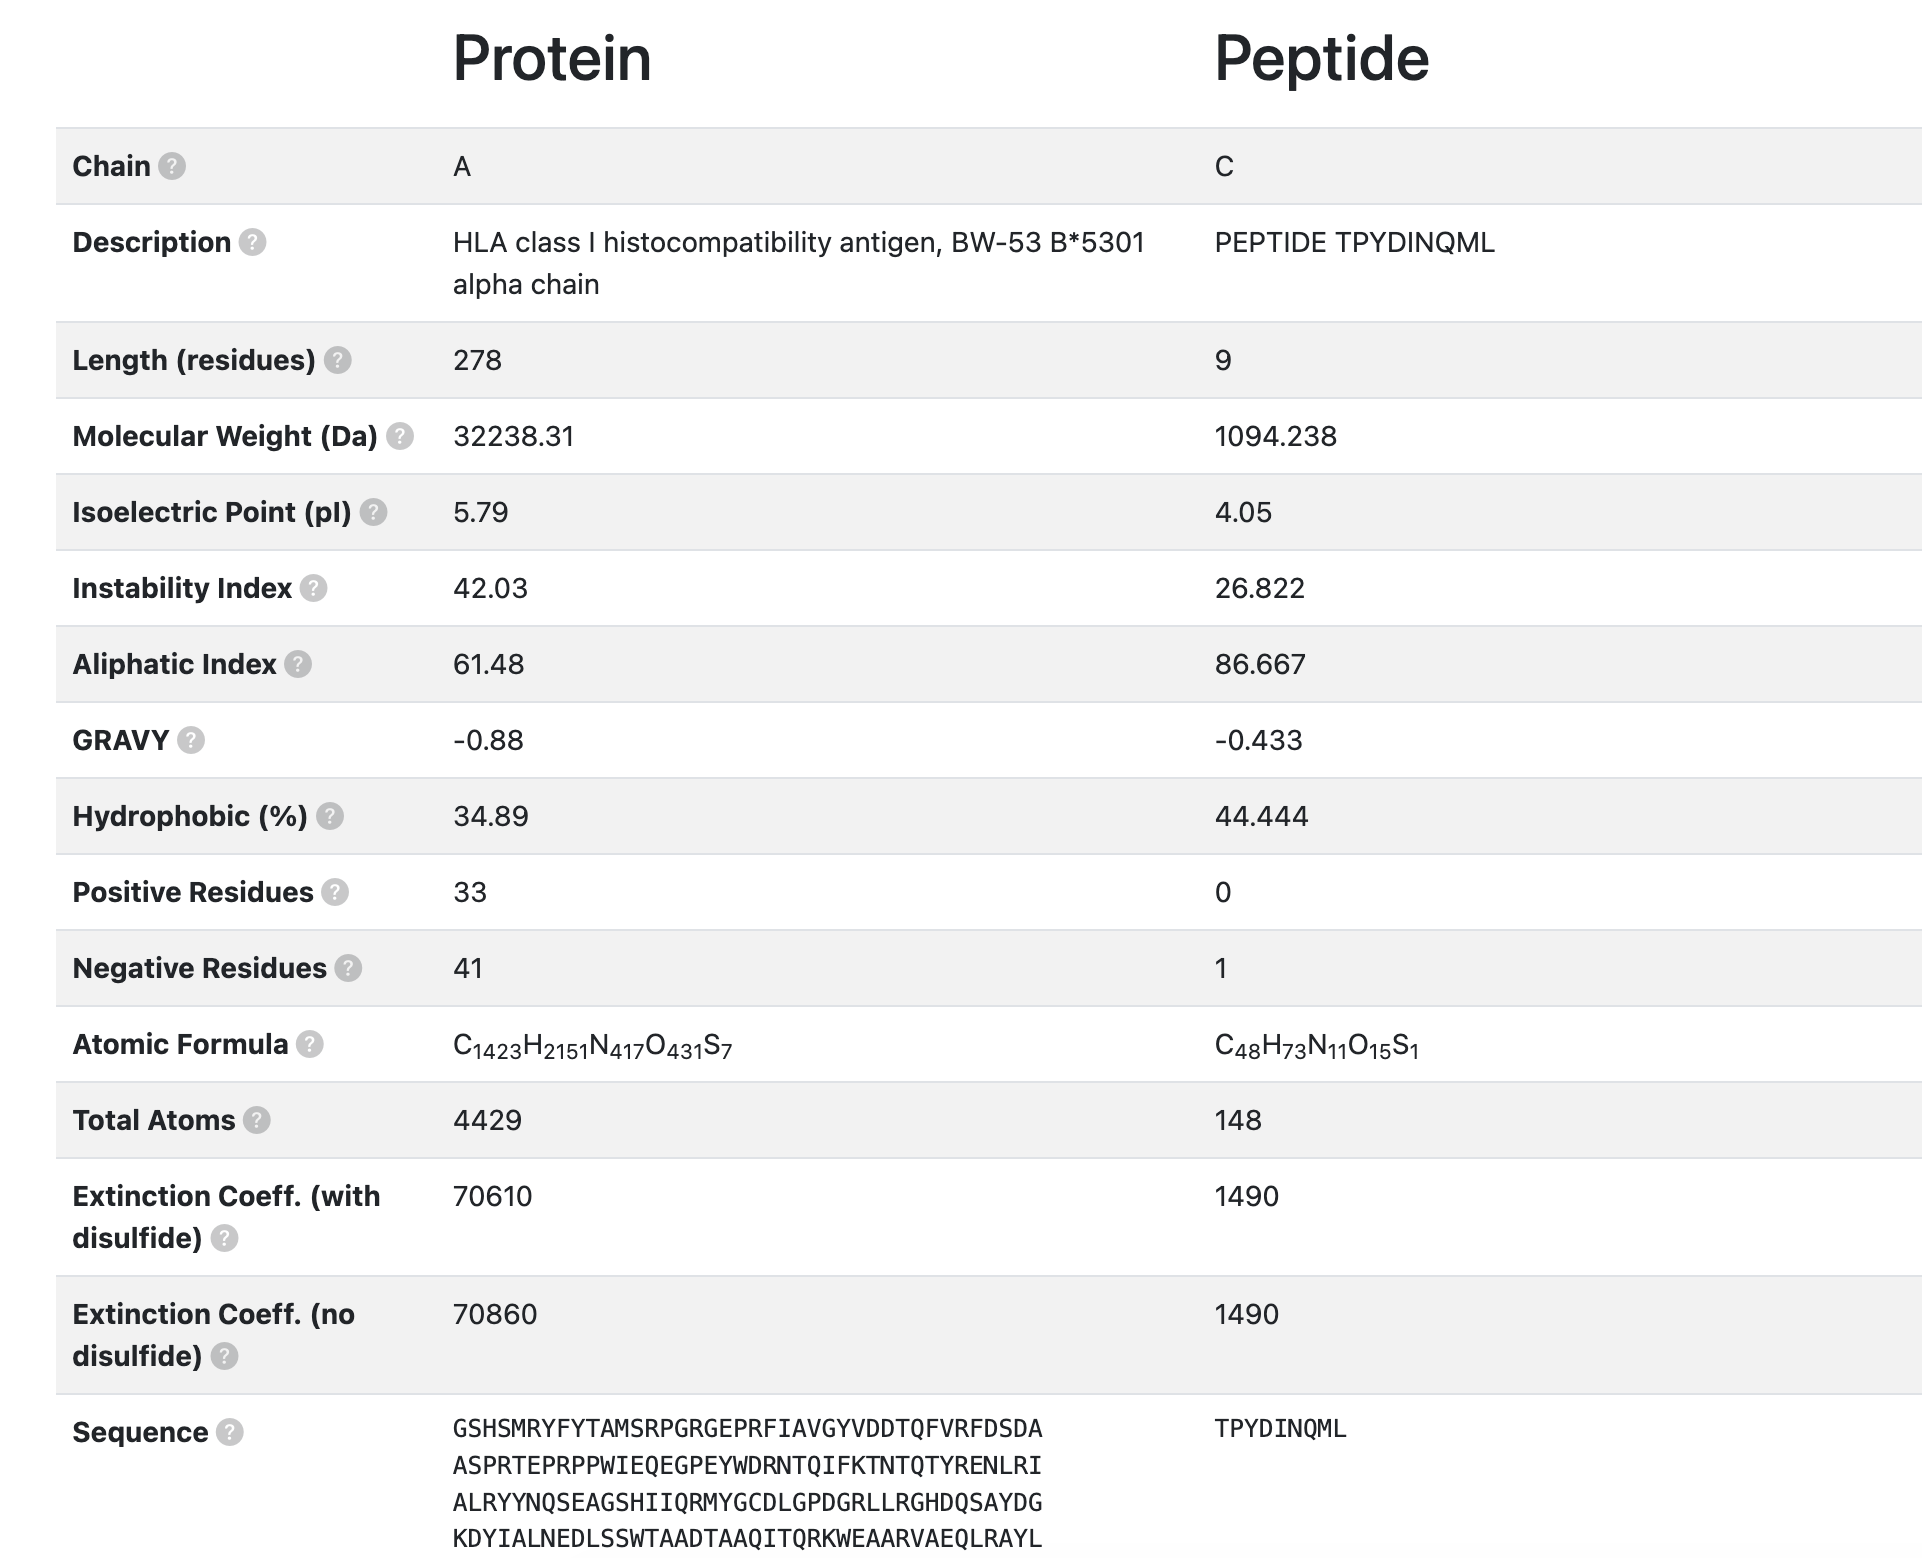
- Chain: Unique identifier assigned to each molecular chain within the same crystallographic structure or PDB entry.
- Description: Annotated name or description of the polymer chain, as defined in the PDB file (e.g., “Chain A - β-glucosidase”).
- Length (residues): Total number of amino acid residues observed in the polymer chain.
- Molecular Weight (Da): Total molecular mass of the chain, expressed in Daltons (Da), calculated as the sum of the atomic masses of all atoms in the protein.
- Isoelectric Point (pI): The pH value at which the protein carries no net electrical charge, resulting in minimal electrophoretic mobility.
- Instability Index: A computed value that estimates the in vitro stability of a protein. Proteins with an instability index greater than 40 are predicted to be unstable, while lower values indicate greater stability.
- Aliphatic Index: A measure of the relative volume occupied by aliphatic side chains (Ala, Val, Ile, and Leu). It is often correlated with the thermostability of the protein.
- GRAVY (Grand Average of Hydropathy): The average hydropathy score of all amino acids in the sequence, based on the Kyte-Doolittle scale. Positive values indicate a more hydrophobic protein, while negative values suggest a more hydrophilic character.
- Hydrophobic (%): The proportion of residues in the sequence that are classified as hydrophobic (e.g., Ala, Val, Leu, Ile, Phe, Trp, Met), expressed as a percentage of the total number of residues.
- Positive Residues: Total number of positively charged amino acids in the sequence (Lys, Arg, and His).
- Negative Residues: Total number of negatively charged amino acids in the sequence (Asp and Glu).
- Atomic Formula: The complete elemental formula representing the protein’s overall atomic composition (e.g., C₂₆₄₄H₄₂₀₅N₇₅₇O₈₁₆S₁₂).
- Total Atoms: The total number of atoms constituting the polypeptide chain.
- Extinction Coefficient (with disulfide): Molar extinction coefficient (in M⁻¹ cm⁻¹) calculated assuming all cysteine residues form disulfide bonds (Cys–Cys). This value indicates the protein’s absorbance at 280 nm under these conditions.
- Extinction Coefficient (no disulfide): Molar extinction coefficient (in M⁻¹ cm⁻¹) calculated assuming no disulfide bond formation, i.e., all cysteine residues remain in the reduced form.
- Sequence: The primary amino acid structure of the protein or peptide, defining its linear arrangement of residues.
2.1.3 Interactive 3D structure visualization panel
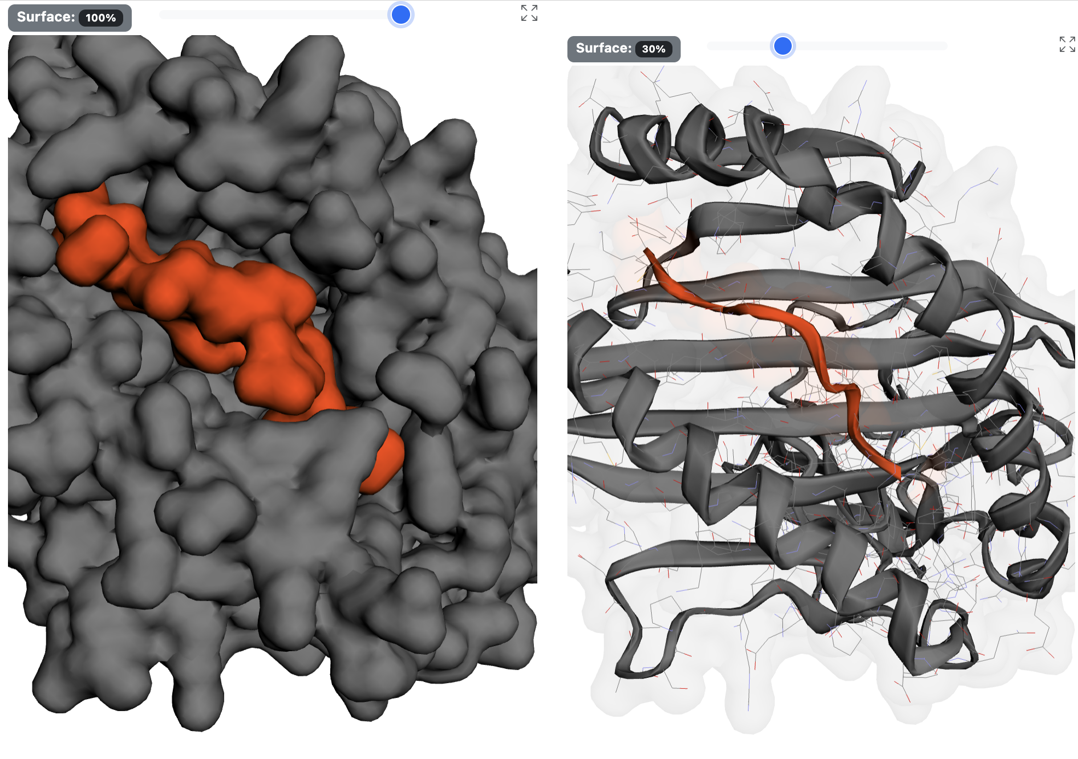
Allows you to interact with the 3D structure of the protein-peptide complex. You can click on the atoms to display their labels. Left-click and drag to move the protein. Use the mouse scroll wheel to zoom.
The bar above the structure holds the viewer controls:
- Lines: shows or hides the bonds of the whole structure, drawn as thin lines over the cartoon.
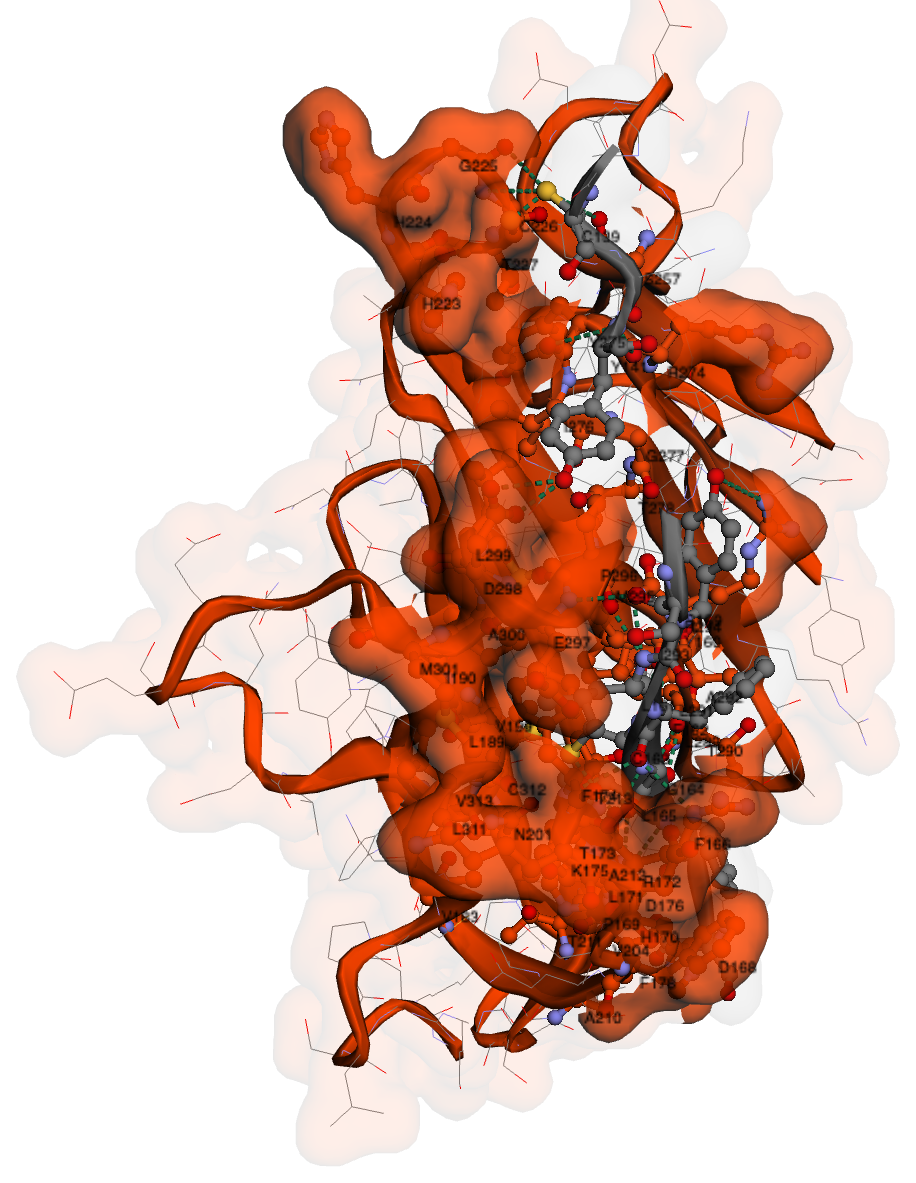
- Interface: highlights the protein-peptide interface. The interface residues of both chains are drawn as sticks and spheres and labelled with the one-letter code and the residue number, the interface residues of the protein receive a denser surface, and the atom-atom contacts of the contact table are drawn as thick dashed lines coloured by contact type (green for hydrogen bonds, blue for salt bridges, cyan for attractive, red for repulsive, black for disulfide bonds and grey for aromatic contacts). Hydrophobic contacts are left out of the drawing, since they are numerous and would hide the rest of the interface; they remain in the contact table and in the contact map.
- Surface: slider that sets the opacity of the surface of each chain, with the current value shown next to it.
- Clear: returns the viewer to its initial state, removing the labels and any residue or contact that was selected.
- Full screen: opens the structure in a full-screen viewer with further options — representation, colour scheme, residue selection, surfaces, labels and contact cutoff. Residue labels are displayed by default there.
Further down the page, each button of the Interface residues list highlights a single residue in this viewer. Clicking one of them switches Interface off, so that the highlight of the whole interface does not compete with the residue being inspected; clicking a row of the contact table highlights the corresponding pair of residues in the same way.
2.1.4 Clustering information
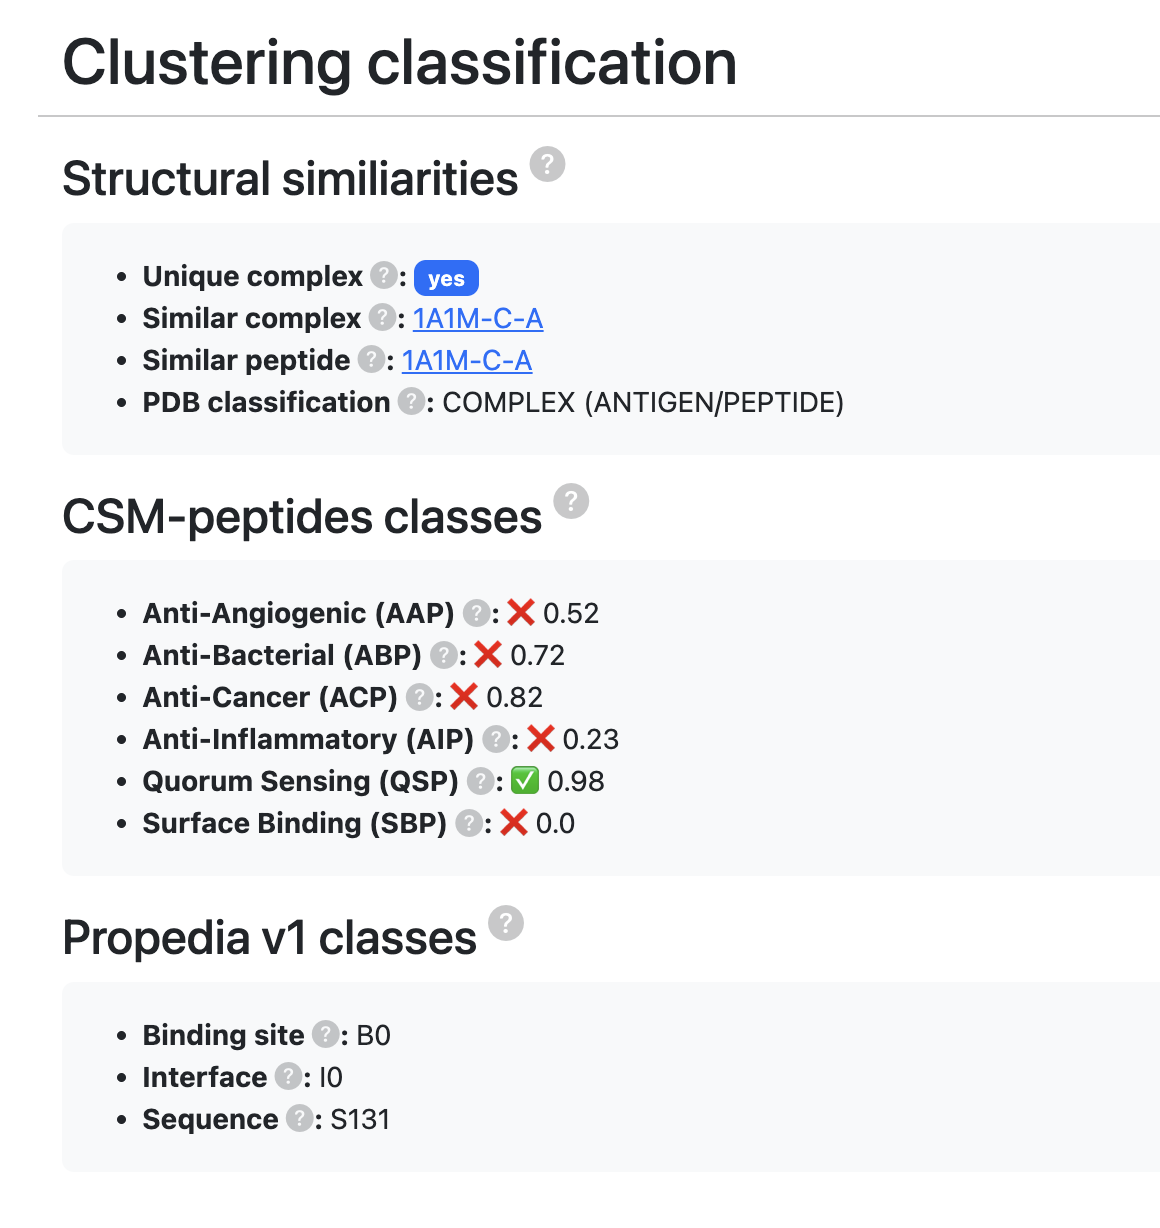
- Unique complex: Indicates whether a protein-peptide pair exists with both sequences identical.
- Similar complex: If there is an identical sequence, it indicates which is the main entry with an exact sequence (if the sequence is unique, the entry itself will be considered the leader).
- Similar peptide: Indicates a complex that has a peptide with the exact same sequence.
- PDB classification: Molecular classification according to PDB.
- CSM-peptides classes: CSM-peptides (link) is a web tool and machine learning model that predicts peptide classes based on their sequence. Using a machine learning model inspired by CSM-peptides, Propedia built six models to predict the function of therapeutic peptides. Here, we present the probability that the current peptide belongs to each class. Values range from 0 to 1 (0 = low likelihood, 1 = high likelihood). For more details, see http://doi.org/10.1002/pro.4442.
- Anti-Angiogenic (AAP): Probability that the peptide belongs to the Anti-Angiogenic class (cutoff ≥ 0.9).
Function: Inhibit angiogenesis (formation of new blood vessels).
Importance: Prevent tumor growth by limiting nutrient supply.
Applications: Antitumor and antiviral therapies. - Anti-Bacterial (ABP): Probability that the peptide belongs to the Anti-Bacterial class (cutoff ≥ 0.9).
Function: Destroy or inhibit bacterial growth.
Mechanism: Interact with bacterial membranes, causing lysis.
Importance: Potential alternative to antibiotics in the context of resistance. - Anti-Cancer (ACP): Probability that the peptide belongs to the Anti-Cancer class (cutoff ≥ 0.9).
Function: Selectively kill tumor cells.
Mechanisms: Alter membrane permeability, trigger apoptosis, modulate signaling pathways.
Applications: Next-generation antineoplastic therapies. - Anti-Inflammatory (AIP): Probability that the peptide belongs to the Anti-Inflammatory class (cutoff ≥ 0.9).
Function: Reduce or regulate inflammatory responses.
Mechanism: Inhibit pro-inflammatory cytokines or modulate macrophages.
Applications: Treatment of chronic inflammatory and autoimmune diseases. - Quorum Sensing (QSP): Probability that the peptide belongs to the Quorum Sensing class (cutoff ≥ 0.9).
Function: Participate in bacterial communication (biofilm formation, virulence).
Importance: Target for non-bactericidal infection control strategies. - Surface Binding (SBP): Probability that the peptide belongs to the Surface Binding class (cutoff ≥ 0.9).
Function: Bind to biological or material surfaces (e.g., metals, polymers, minerals).
Biotechnological Uses: Immobilization of enzymes, biomaterials, biosensors, nanodevices.
Examples: Peptides that bind to gold, silica, metal oxides for nanotechnology.
2.1.5 Protein-peptide interaction information
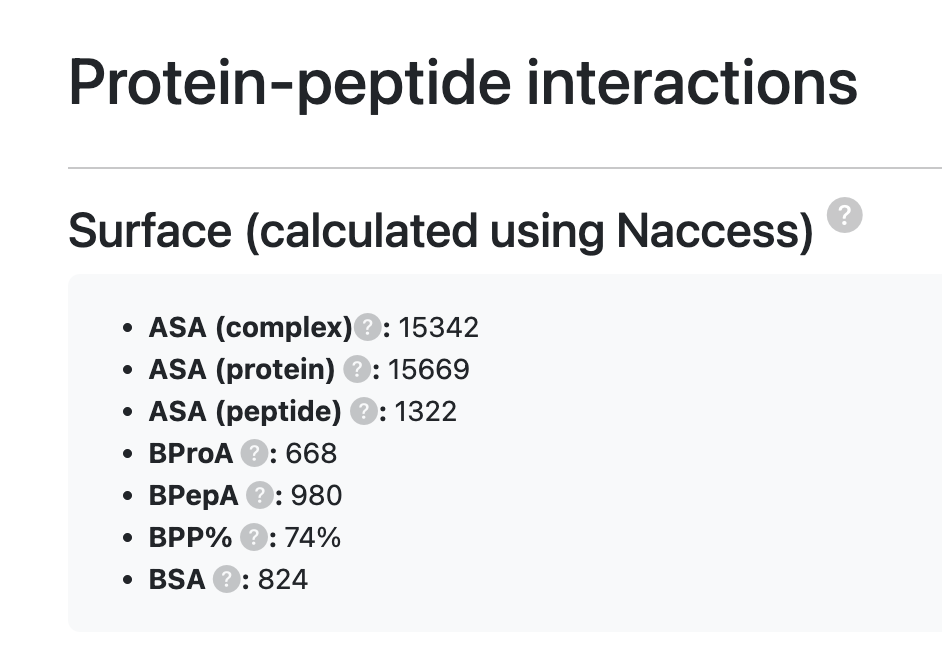
- Surface (calculated using Naccess): Accessible surface analyses were performed using the NACCESS program, which implements the classic Lee & Richards algorithm (see reference) to calculate the Accessible Surface Area (ASA). This method simulates the path of a 1.4 Å radius spherical probe — equivalent to the approximate size of a water molecule — over the structure's van der Waals surface, estimating the total area exposed to the solvent.
- ASA: Accessible Surface Area (ASA) is the measure of the entire surface area of the molecule that is exposed and can come into contact with the solvent (usually water).
- ΔASA (protein): ΔASAprotein represents the surface area that is no longer exposed to the solvent upon complex formation and is calculated by the equation: ΔASA = ASAunbound − ASAbound. (Value given in Ų)
- ΔASA (peptide): ΔASApeptide represents the surface area that is no longer exposed to the solvent upon complex formation and is calculated by the equation: ΔASA = ASAunbound − ASAbound. (Value given in Ų)
- BProA: Buried protein area (value given in Ų).
- BPepA: Buried peptide area (value given in Ų).
- BPP%: Buried Peptide Percentage (%), obtained by the expression: 100 × BPepA / ΔASApeptide.
- BSA: Buried Surface Area represents the area effectively shared at the binding interface and can be calculated using the formula: BSA = (ASAprotein + ASApeptide − ASAcomplex) / 2.
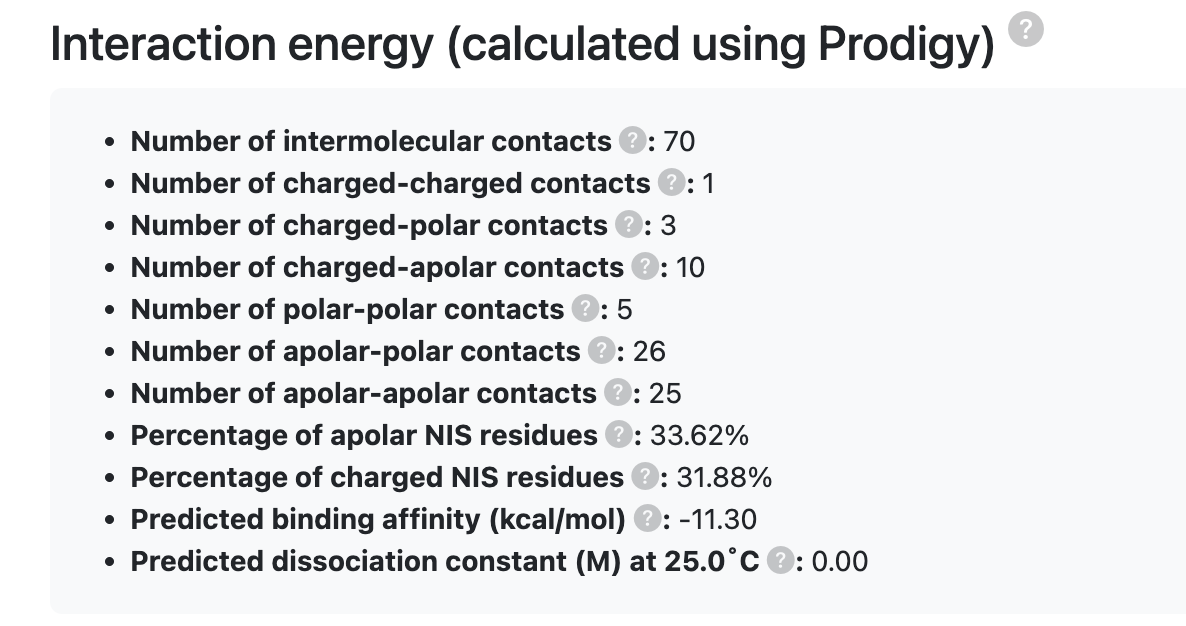
- Interaction Energy (calculated using PRODIGY): Estimated binding free energy (ΔG) of the protein–peptide complex, predicted by the PRODIGY command-line tool. See the documentation for details. More information about the methodology can be found at the Prodigy website.
- Number of Intermolecular Contacts: Total number of atomic contacts between the protein and peptide within a specified cutoff distance (typically ≤ 5.5 Å). A higher number of contacts generally indicates a more extensive interaction interface.
- Number of Charged–Charged Contacts: Number of interactions between oppositely charged residues (e.g., Lys–Asp, Arg–Glu) across the interface, contributing significantly to electrostatic stabilization.
- Number of Charged–Polar Contacts: Count of contacts between charged residues and polar uncharged residues (e.g., Lys–Ser, Asp–Thr), which often form hydrogen bonds or dipole interactions.
- Number of Charged–Apolar Contacts: Number of contacts between charged residues and hydrophobic residues (e.g., Arg–Leu, Lys–Val). These interactions contribute less to stability but may influence interface geometry.
- Number of Polar–Polar Contacts: Number of interactions between polar uncharged residues (e.g., Ser–Thr, Asn–Gln), frequently involving hydrogen bonding or dipole alignment across the interface.
- Number of Apolar–Polar Contacts: Count of interactions between hydrophobic and polar residues, contributing to partial desolvation and interface packing.
- Number of Apolar–Apolar Contacts: Number of hydrophobic–hydrophobic interactions (e.g., Leu–Val, Phe–Ile) that stabilize the interface through exclusion of water molecules (hydrophobic effect).
- Percentage of Apolar NIS Residues (%): Proportion of residues in the Non-Interacting Surface (NIS) that are apolar, expressed as a percentage. Indicates the hydrophobic character of the exposed surface outside the binding interface.
- Percentage of Charged NIS Residues (%): Proportion of residues in the NIS that are charged (positive or negative), indicating the electrostatic character of the surface not involved in binding.
- Predicted Binding Affinity (kcal·mol⁻¹): Estimated Gibbs free energy of binding (ΔG), in kilocalories per mole. More negative values correspond to stronger binding.
- Predicted Dissociation Constant (M) at 25.0 °C: Predicted dissociation constant (Kd), in molar units (M), at 25 °C. Represents the expected concentration at which half of the binding sites are occupied. Lower values indicate stronger affinity.
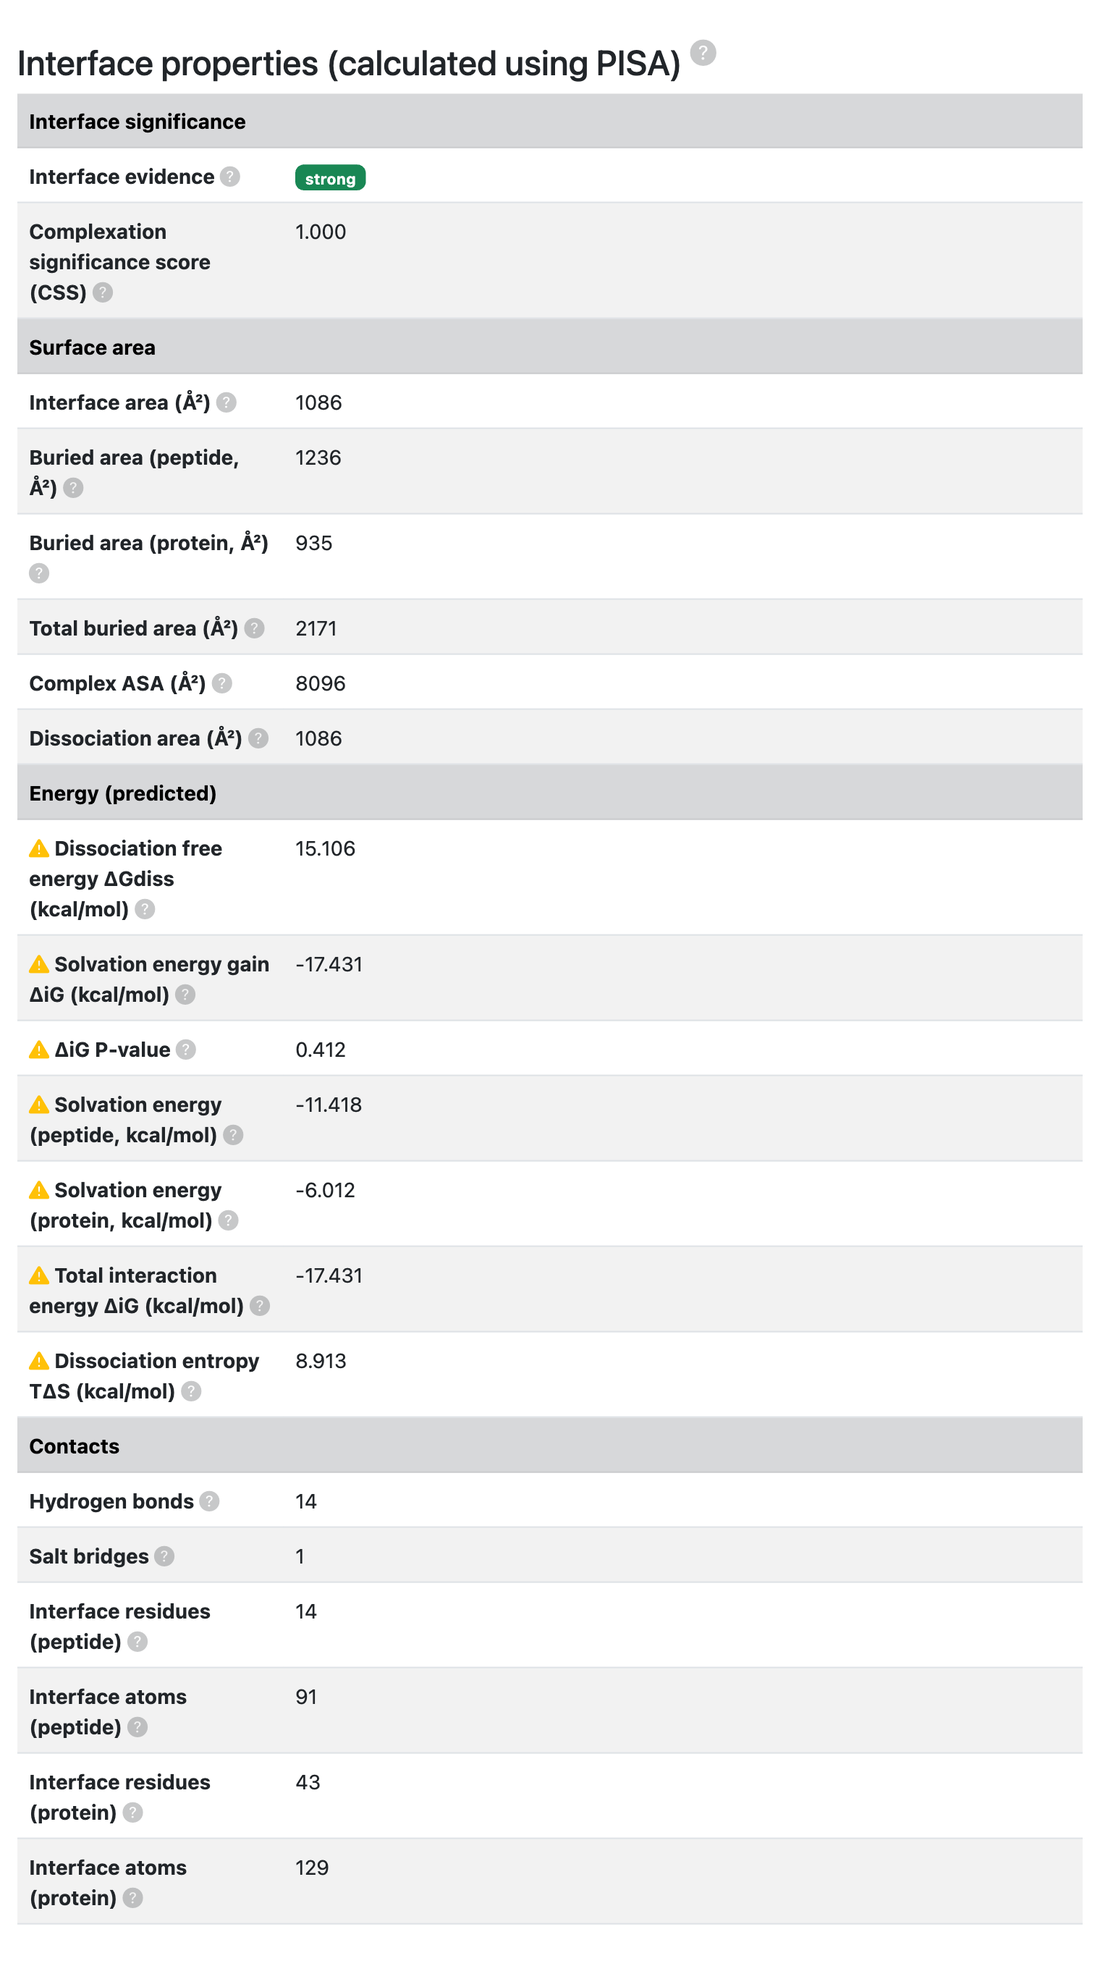
Interface properties (calculated using PISA)
The interface is also evaluated with PISA (Protein Interfaces, Surfaces and Assemblies, see PDBePISA and Krissinel & Henrick, 2007), which describes the chemical and energetic properties of the association and estimates how much the interface contributes to the assembly. The entry page presents these values in four groups. When PISA could not process the structure, the page shows a message in place of the table; individual fields that PISA did not compute are shown as “-”.
Interface significance
- Interface evidence: reading of the Complexation Significance Score adopted by Propedia. Strong means the interface sustains the assembly (CSS of 0.5 or above), moderate means it contributes to it (CSS between 0 and 0.5) and weak means it plays no role in the assembly (CSS = 0). Not assessed means PISA could not evaluate the structure.
- Complexation Significance Score (CSS): how much this interface contributes to the formation of the assembly, from 0 to 1. PISA computes it only for structures solved by diffraction, so it is empty for entries solved by electron microscopy, NMR and other methods.
Surface area
- Interface area (Ų): area of one face of the protein-peptide interface. It corresponds to the BSA calculated with NACCESS, reported above.
- Buried area (peptide, Ų) and Buried area (protein, Ų): surface area of each chain that becomes buried upon formation of the interface.
- Total buried area (Ų): total surface area buried by the association, counting both faces of the interface. It is therefore about twice the BSA reported by NACCESS, which counts a single face.
- Complex ASA (Ų): accessible surface area of the complex, the PISA counterpart of the ASA (complex) calculated with NACCESS.
- Dissociation area (Ų): interface area that is broken when the complex dissociates. It usually coincides with the interface area.
Energy (predicted)
- Dissociation free energy ΔGdiss (kcal/mol): free energy required to dissociate the complex. Positive values indicate a thermodynamically stable complex. It is the PISA counterpart of the binding affinity predicted by PRODIGY, with the opposite sign.
- Solvation energy gain ΔiG (kcal/mol): free energy gain obtained on formation of the interface. Negative values indicate a hydrophobic interface, which favours the association. It does not include the contribution of hydrogen bonds and salt bridges across the interface.
- ΔiG P-value: statistical significance of the solvation energy gain. Values below 0.5 indicate an interface more hydrophobic than would be expected by chance, that is, an interface likely to be interaction-specific rather than a crystal-packing artefact.
- Solvation energy (peptide, kcal/mol) and Solvation energy (protein, kcal/mol): contribution of each chain to the solvation free energy gain of the interface.
- Total interaction energy ΔiG (kcal/mol): solvation energy gain summed over all the interfaces of the structure. It is equal to the interface ΔiG when the structure has a single interface.
- Dissociation entropy TΔS (kcal/mol): entropic cost of the association. It always opposes the formation of the complex and is taken into account in the calculation of ΔGdiss.
The energies reported by PISA are estimates from an empirical model, not experimental measurements, and are marked as predicted values on the entry page. Use them as an indication and confirm them before drawing conclusions.
Contacts
- Hydrogen bonds and Salt bridges: number of hydrogen bonds and of interactions between oppositely charged groups identified by PISA across the interface. They are computed independently of the COCaDA contacts listed below, so the counts may differ.
- Interface residues (peptide) and Interface residues (protein): number of residues of each chain that take part in the interface, that is, residues that lose accessible surface area upon complex formation.
- Interface atoms (peptide) and Interface atoms (protein): number of atoms of each chain that take part in the interface.

- Interface Residues (distmax ≤ 6 Å): List of residues located within 6 Å of the interacting partner, defining the binding interface between the protein and peptide.
- Contacts (calculated using COCaDA): Number and type of interatomic contacts calculated by the COCaDA tool (https://bioinfo.dcc.ufmg.br/cocada-web), used to characterize specific atom–atom interactions across the interface.
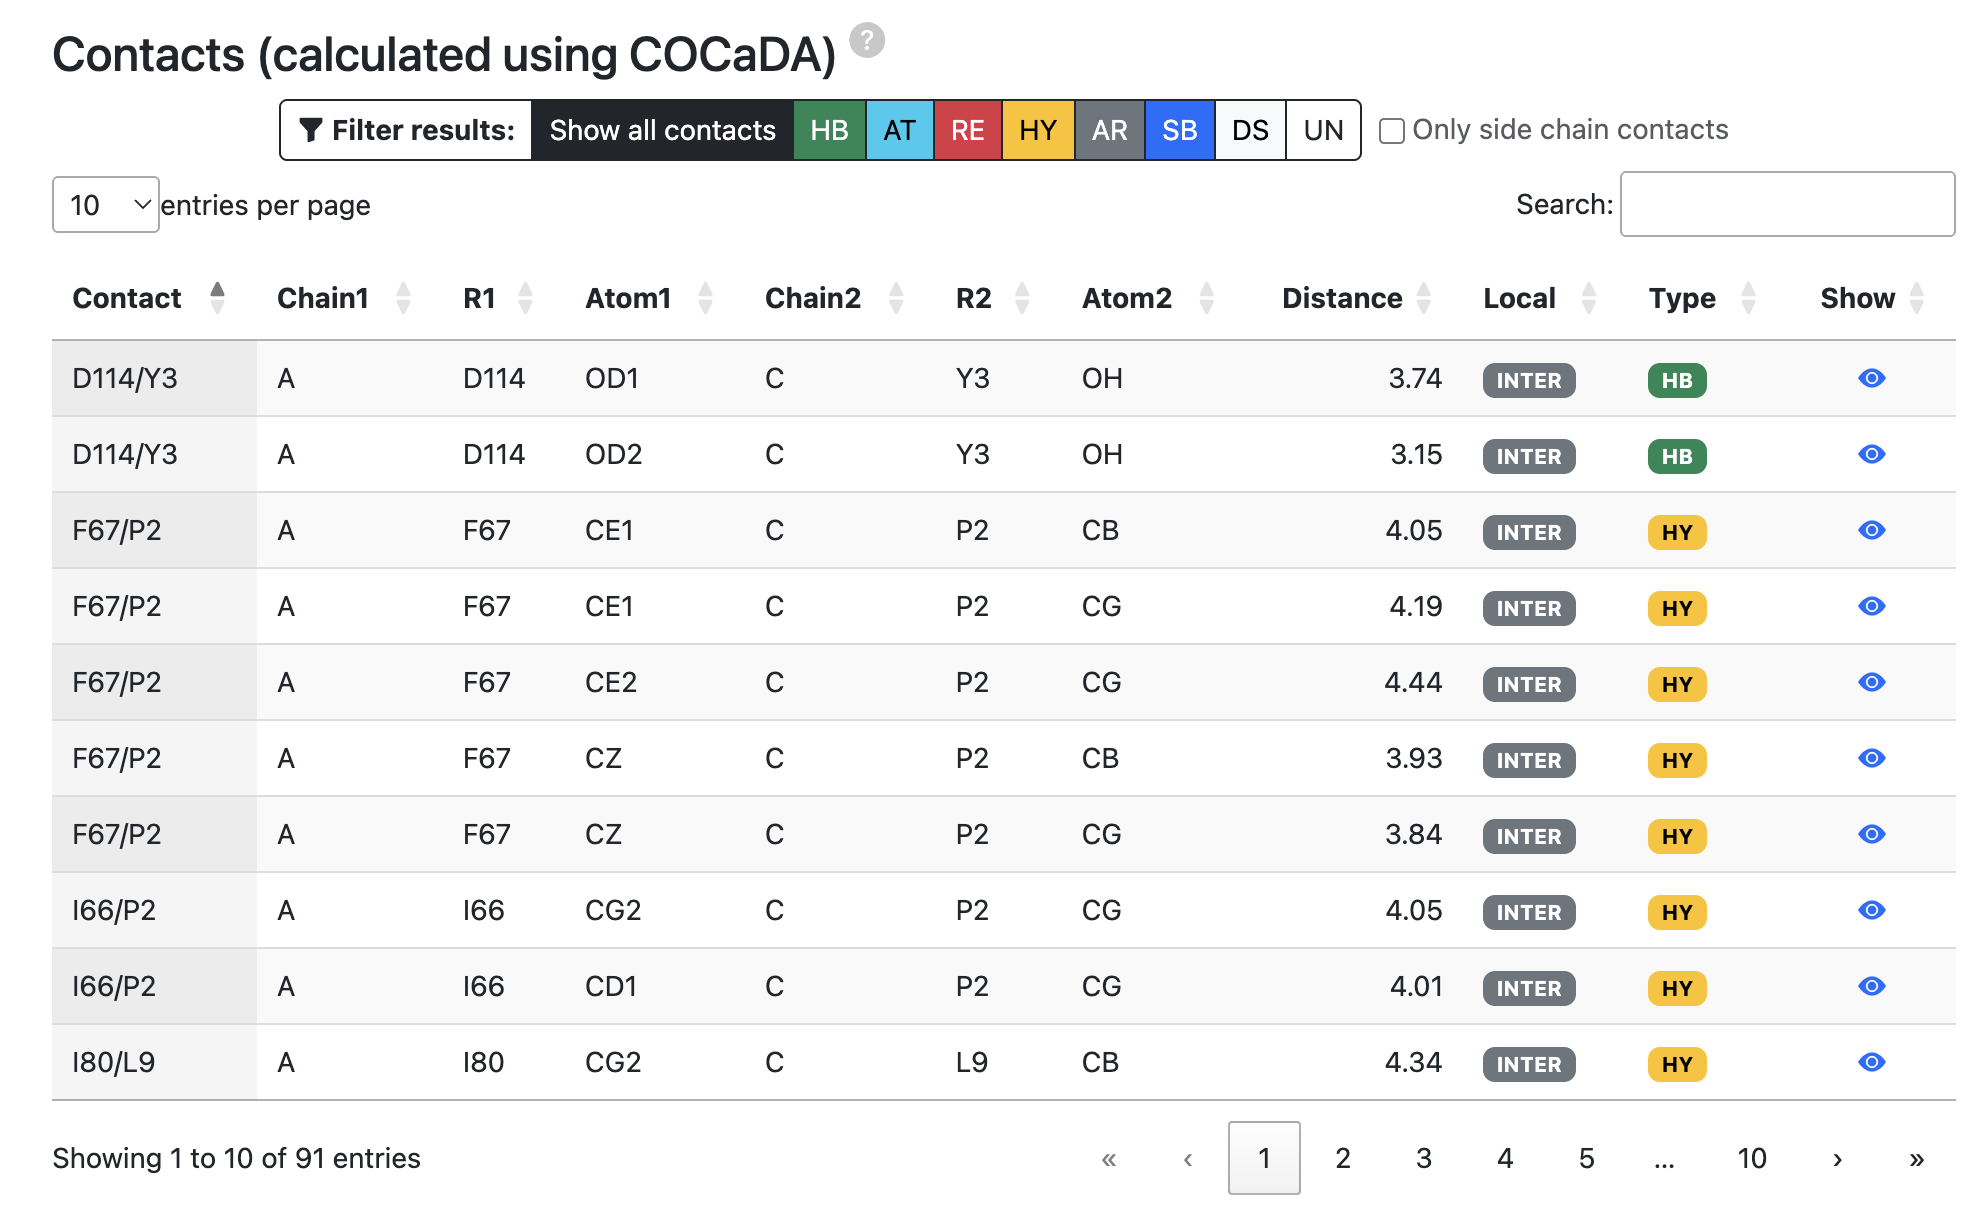
Contact map captions:
- HB: Hydrogen bond
- HY: Hydrophobic
- AT: Attractive
- RE: Repulsive
- AR: Aromatic
- SB: Salt Bridge
- DS: Disulfide bonds
- UN: Unknown
Criteria for defining contacts:
| Contact Type | Distance range (Å) | Description | Acronym |
|---|---|---|---|
| Hydrogen Bond | 0 ≤ dist ≤ 3.9 | Acceptor and Donor atom pair | HB |
| Disulfide Bond | 0 ≤ dist ≤ 2.8 | Cys:SG atom pair | DS |
| Hydrophobic | 2.0 ≤ dist ≤ 4.5 | Hydrophobic atom pair | HY |
| Repulsive | 2.0 ≤ dist ≤ 6.0 | Equally charged atoms | RE |
| Attractive | 3.9 ≤ dist ≤ 6.0 | Differently charged atoms | AT |
| Sulft Bridge | 0 ≤ dist ≤ 3.9 | Equally charged atoms AND hydrogen bonding | SB |
| Aromatic Stacking | 2.0 ≤ dist ≤ 5.0 | Centroids of two aromatic rings in parallel or perpendicular orientation | AS |
Source: https://bioinfo.dcc.ufmg.br/cocada-web/public/documentation
2.2 BLAST tool
The BLAST (Basic Local Alignment Search Tool) identifies local similarities between protein sequences. It compares a query sequence with sequences stored in a database, evaluating the statistical relevance of the matches found (Mariano et al., 2015; Wheeler; Bhagwat, 2016). The BLAST tool available in PROPEDIA allows users to search for peptides or proteins similar to those present in the database, using local alignment based on sequence similarity. This functionality is essential for identifying structurally or functionally related complexes, locating similar peptides already described in the database, and facilitating comparative studies, evolutionary analyses, and functional inference.
The Propedia sequence search system is implemented using the BLAST+ package, as described in Altschul et al. (1990) and Camacho et al. (2009). The tool compares the sequence provided by the user with all sequences deposited in PROPEDIA 26, returning the best local alignments, along with identifiers of the associated complexes, similarity metrics, and coverage and identity information.
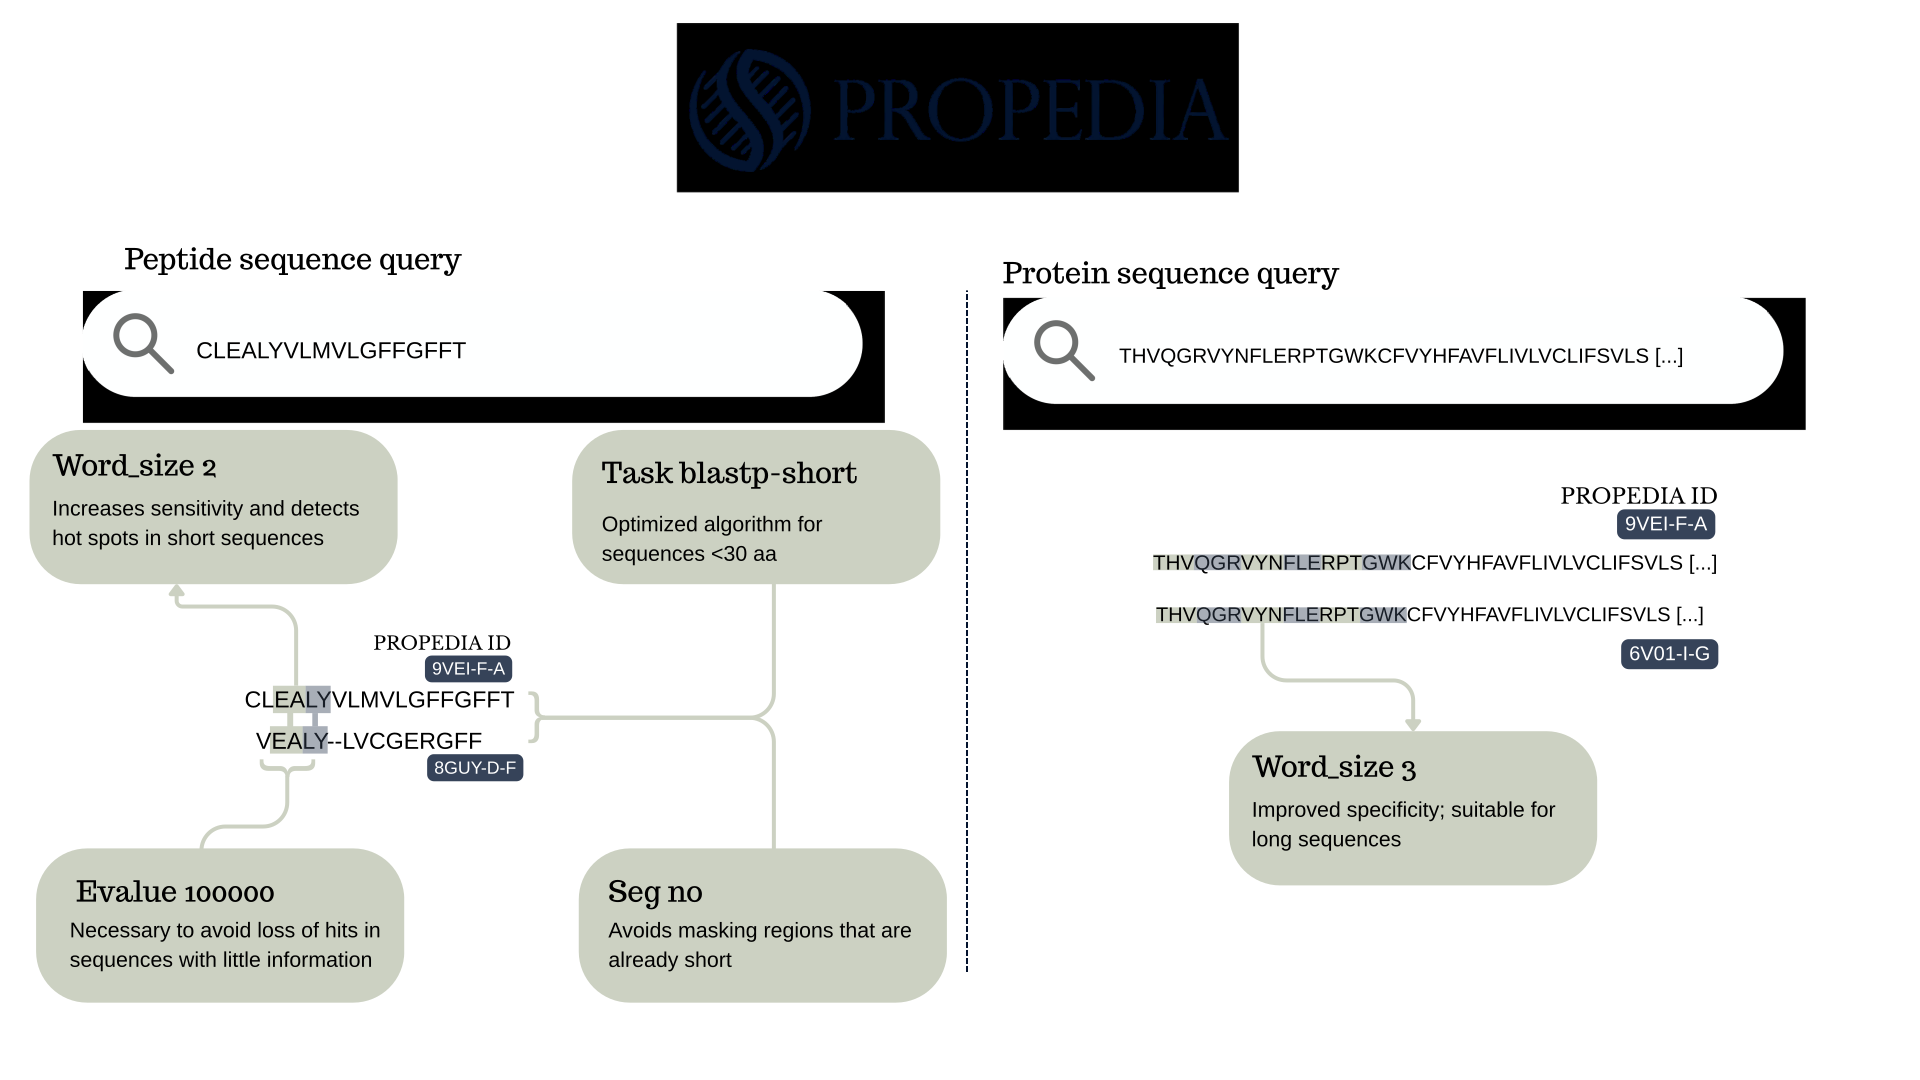
The search can be performed for both peptides and proteins, and each type of query uses different parameters, adjusted for greater sensitivity according to the size of the sequence analyzed.
2.2.1 Parameters and Configuration
Peptides have short sequences and require specialized parameters to ensure good sensitivity. For this reason, Propedia uses:
- word_size 2
The word-size is a NCBI parameter which determines the minimum size of the fragment (“word”) that must match between the query sequence and the database sequences for the algorithm to initiate an alignment extension. A word is the smallest sequence block that BLAST uses to identify possible regions of similarity between the query sequence and the database. The sequence is fragmented into all possible word sizes. For example, if word-size = 3, the protein ACDEFG becomes: ACD, CDE, DEF, EFG. BLAST searches the database for identical or similar occurrences of these words.
As described in the NCBI documentation (“BLAST Search Parameters - BlastTopics 0.1.1 documentation”, [s.d.]), BLAST operates heuristically, first identifying “hot spots,” i.e., short local matches, which can then expand into more complete alignments. In protein searches, these matches do not need to be identical and may involve similarity based on the substitution matrix. According to BLAST logic, reducing the word size increases sensitivity, as it allows relevant matches to be detected even when the comparison space is limited. Thus, using word size = 2 favors the detection of small hot spots capable of initiating extensions in peptide queries.
- task blastp-short
The task blastp-short parameter activates an optimized version of BLASTP specifically configured to handle short protein sequences, typically with fewer than 30 amino acids (Table C3: [blastp application options. The blastp...].”, 2021). This mode automatically adjusts various internal aspects of the algorithm to maximize sensitivity and detection of real similarity, even when the amount of information (sequence length) is very low.
In implementing the sequence search system in Propedia, -word_size 2 was used in conjunction with -task blastp-short. This choice is directly aligned with the expected behavior for searches involving short peptides, whose sequences have few positions for forming larger “words.”
- seg no
A tool designed to filter low-complexity segments in amino acid sequences. In alignments, residues that have been masked are displayed as “X.” SEG filtering is no longer the default option in the NCBI blastp service due to the adoption of compositional adjustments for estimating BLAST statistics (Fassler; Cooper, 2011). The -seg no parameter disables complexity masking, which would be undesirable in such short sequences.
- evalue 100000
The E-value represents the probability that an observed alignment arose by chance. Under normal conditions, values close to zero indicate highly significant alignments, while high values tend to be disdocs-carded because they represent statistical noise. However, the behavior of the E-value changes dramatically for short sequences, such as peptides, which is exactly the case with Propedia. These settings allow minimal peptides, including fragments with only 5-10 amino acids, to find significant matches in the database.
For complete proteins, Propedia uses a more conservative set of parameters that are better suited for long sequences:
- word_size 3
When dealing with full-length protein sequences, the search behavior differs substantially from searches involving short peptides. Longer sequences contain a much larger amount of information, allowing BLAST to reliably detect similarity using more stringent initial seeds. In this context, the parameter word_size 3 is more appropriate because it requires longer contiguous matches (3 amino acids) before extending an alignment. This choice reduces noise, improves specificity, and accelerates the search, as larger words decrease the number of initial “hotspots” generated during the seeding phase. Since full proteins typically range from hundreds to thousands of residues, a word-size of 3 does not compromise sensitivity: even distantly related proteins usually share enough local similarity to satisfy this requirement.
Therefore, for protein-versus-protein searches, PROPEDIA adopts a more conservative configuration to balance sensitivity and performance. This contrasts with peptide searches, where shorter sequences require extremely permissive parameters. The distinction ensures that each type of query, short peptides versus complete proteins, is processed using criteria tailored to its biological characteristics and statistical behavior under the BLAST algorithm.
A summary of all parameters is illustrated in Figure 20. It is important to note that BLAST alignment will always search for peptides if the input is a peptide sequence, or proteins if the input is a protein sequence.
2.2.2 How to use Propedia BLAST?
When you access the Propedia website, the home page displays “BLAST” in the navigation bar (Figure 6, 3). Clicking on it will open a window where you can enter your peptide or protein sequence (Figure 5). Before running BLAST, you must indicate whether your sequence is peptide or protein, because, as seen in section 2.1.1, the parameters for alignment are different for each type of sequence. To start, simply click on the “Run Blast” button and wait a few seconds for the result.
2.2.3 Other search tools
Propedia allows users to search in three ways: (1) BLAST; (2) based on link sites (uses ProBis); and (3) traditional search bar (uses regular expressions to find entries based on descriptions). We will discuss this further in the following sections.
2.3 Clusters
The Clusters page of Propedia v26 presents an organized view of clusters obtained from different methods of similarity between proteins, peptides, and interaction interfaces. These clusters are fundamental for exploratory navigation, redundancy identification, structural comparison, and functional inference.

The different clusters are summarized in the table below.
| Cluster Type | Description |
|---|---|
| Seq100 | Peptides exhibiting complete sequence identity (100%) are clustered within this category |
| Redundant Sequences | Complexes built from protein–peptide pairs sharing 100% identical sequences are grouped within this category |
| Classifications (PDB) | Entries in this category are grouped based on the classes defined within their respective PDB files |
| Sequence (Propedia v1) | Inherited from Propedia v1; see the seq100 category for the clustering approach used in Propedia26 for new entries* |
| Interface (Propedia v1) | This category originates from Propedia v1* |
| Binding Site (Propedia v1) | This category originates from Propedia v1* |
| CSM-peptides inspired | CSM-peptides is a sequence-based prediction server employing machine learning to assign functional categories to biologically active peptides. Using approaches adapted from Rodrigues et al. (2022), we developed models to classify Propedia26 peptides into six classes: AAP, ABP, ACP, AIP, QSP, and SBP. |
2.3.1 History and evolution of clustering in Propedia
Early versions of Propedia used three main clustering approaches:
- Sequence-based clusters: constructed with Hammock v1.2, which identified identical or highly similar peptide sequences. In the initial version, 3,495 unique sequences were detected, grouped into 771 clusters and 1,074 singletons, totaling 1,845 peptide clusters.
- Interface-based clusters: generated using MUSTANG, which performs multiple structural alignments. This method identified 535 clusters and 1,356 singletons, resulting in 1,891 interfaces.
- Binding-site-based clusters: defined by the ProBiS algorithm, which detects local similarities between protein surfaces. A total of 521 clusters and 945 singletons were formed, totaling 1,466 distinct binding sites.
These methods allowed the user to identify peptides that could interact with the same site or exhibit similar structural properties. Propedia 2.3 introduced the use of structural signatures to detect similarity patterns. However, this was not used for clustering; it was only used to evaluate previous results.
2.3.2 Redundancy and cluster formation in version 26
In version 26 of Propedia, the pipeline has been expanded and modernized. The main steps include:
- Redundancy detection by sequence combination: proteins and peptides have their sequences concatenated, allowing completely identical complexes to be identified. This resulted in 51,416 unique complexes across the protein-peptide and multipro sets (38,218 of them in the protein-peptide set).
- Canonical Non-Redundant (CNR) dataset: from all peptides containing only canonical amino acids, 11,380 unique peptide sequences were extracted, forming the new set of non-redundant peptides (17,440 unique sequences when peptides with non-canonical residues are also counted).
- Recalculation of previous clusters: all clusters from past versions were redone using Python scripts and modern structural analysis tools.
- Automated annotation and classification: structural and functional parameters were extracted directly from PDB files using the Biopython library (Bio.PDB).
As a result, the clustering process became more robust, scalable, and reproducible.
2.3.3 Practical applications of clusters
The clusters provided by Propedia v26 are a central tool for exploring, comparing, and selecting protein-peptide complexes. In the Clusters tab, users can browse clusters organized by three complementary criteria: peptide sequence similarity, interface structural similarity, and binding site similarity. For each cluster, the interface displays the group size, its members, and similarity metrics. It is also possible to directly access the page for each complex, where relevant structural, physicochemical, and functional properties are available.
These features not only facilitate exploration of the database, but also support several practical applications:
- Identification of peptides with similar binding patterns: integrated visualization of interfaces, sites, and alignments allows you to quickly locate peptides that share modes of interaction, helping to identify conserved hotspots and understand the molecular determinants of recognition.
- Detection and control of redundancy in experiments and computational analyses: by displaying the composition of clusters and allowing the selection of centroids, the system helps remove redundant complexes before statistical analyses, machine learning training, or docking benchmarks, reducing biases and increasing data representativeness.
- Structural comparisons in evolutionary and functional studies: Structural and site clusters allow exploration of relationships between complexes that maintain similar binding modes, even when they have low sequence identity.
- Selection of candidates for molecular repositioning or rational peptide design: the combination of sequence, interface, and intra-cluster variability information helps identify peptides with the potential to be reused in new target proteins or as a starting point for rational engineering. Clusters reveal peptides that are structurally compatible or capable of mimicking specific interactions.
By integrating visualization, similarity metrics, and direct access to the structural characteristics of the complexes, the Clusters tab provides a solid foundation for in silico screening, structural biology studies, bioinformatics, and the discovery of new therapeutic molecules. Also, at the bottom of the page, you will find a download button that allows you to download the entire cluster of interest.
2.4 Available downloads
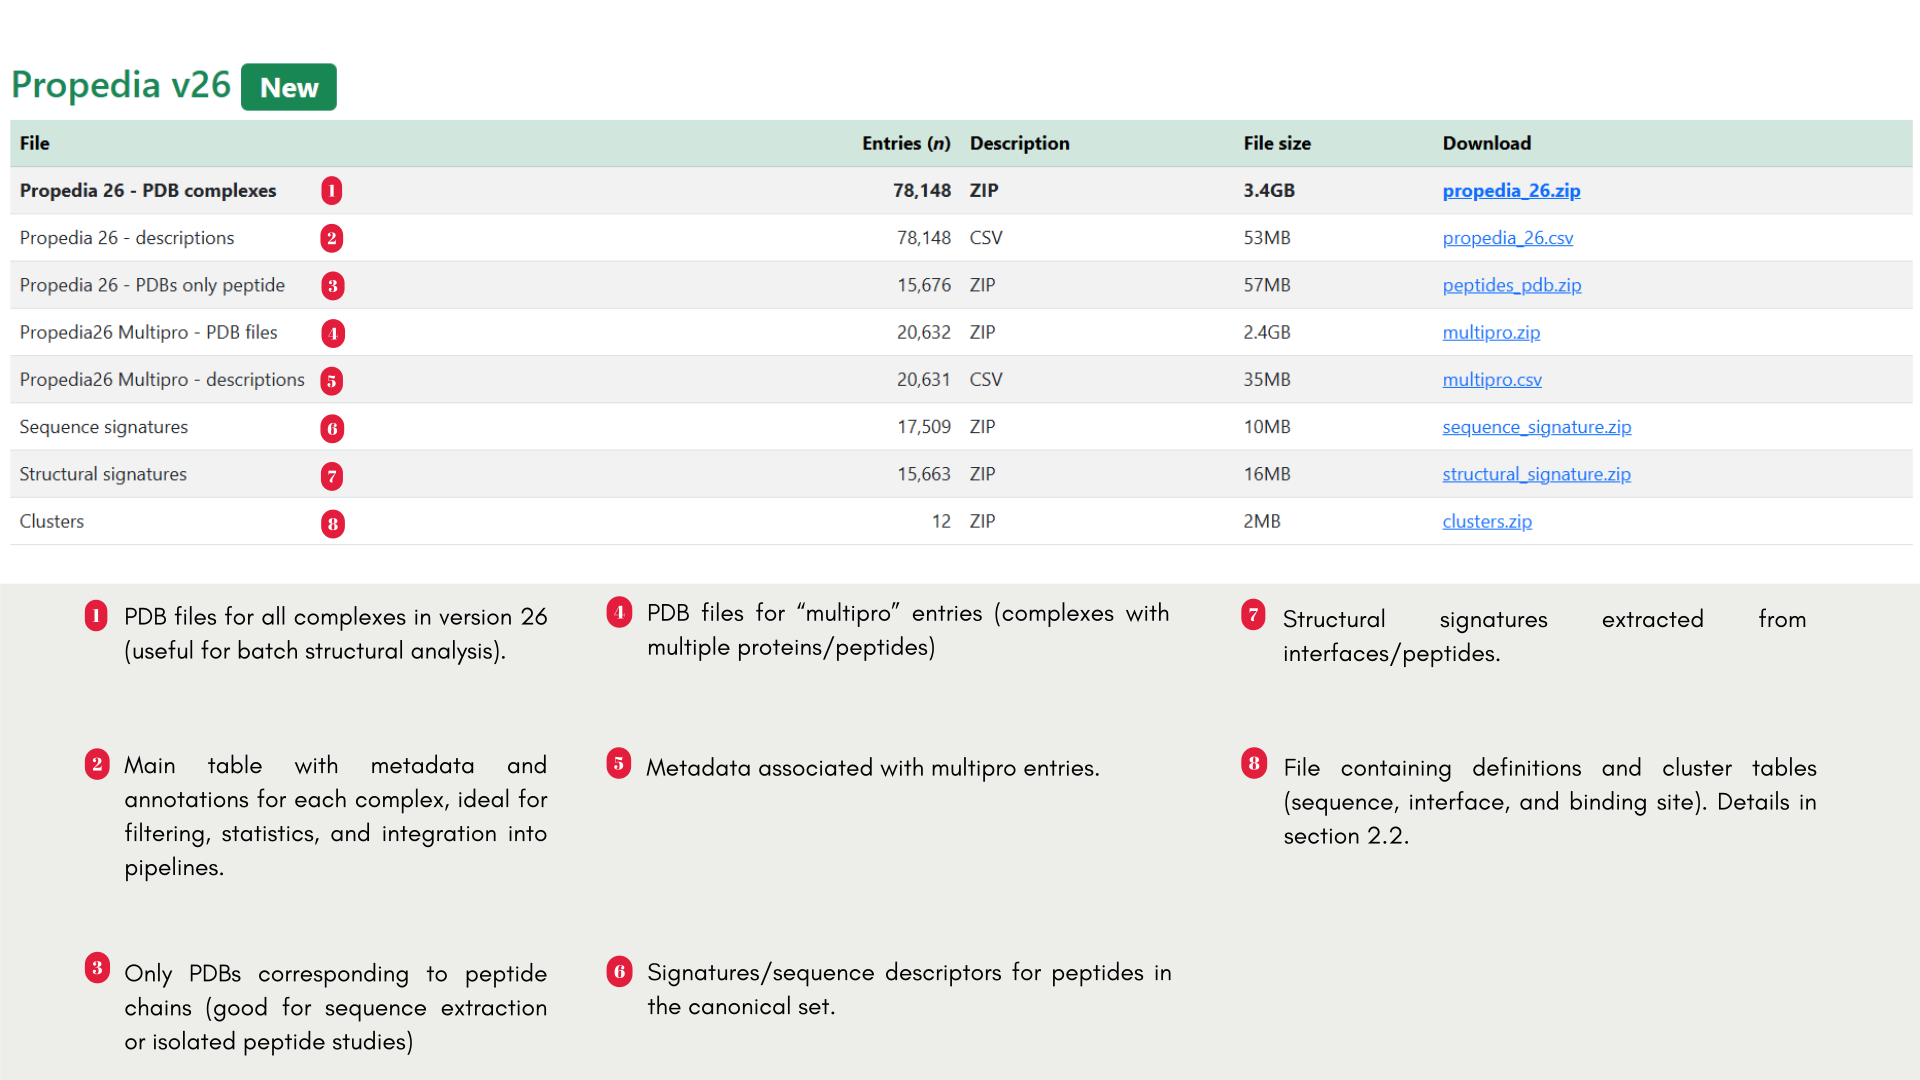
The Downloads section provides access to key files and resources derived from the database. The main list (Propedia v26 - New) is illustrated in the Figure below.
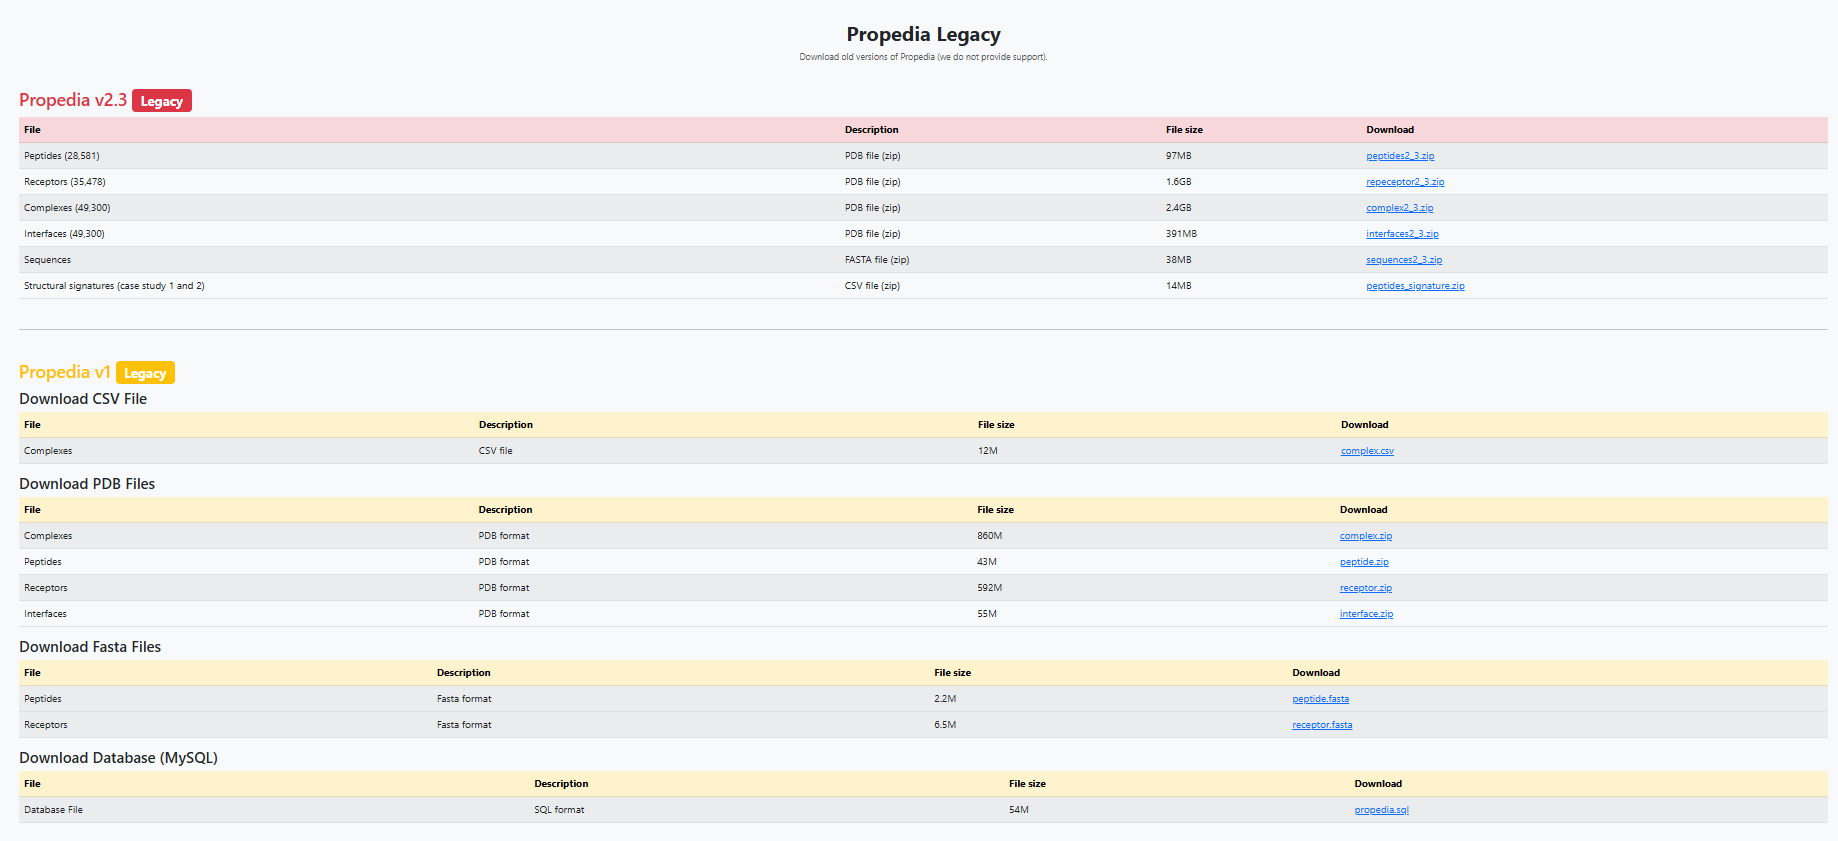
In addition to the main section, the page provides legacy versions (Propedia v2.3 and Propedia v1) with historical files (summarized in Figure 23), for example:
- Propedia v2.3: separate sets of PDBs (peptides, receptors, complexes), signatures, and FASTA files. Useful for reproducibility of previous work.
- Propedia v1: complete CSV files, PDBs, and SQL dumps from the original database.
2.4.1 Quick usage recommendations
- For tabular analysis and subset selection: download propedia_26.csv and open with pandas/R.
- For batch structural reprocessing: download propedia_26.zip (or multipro_v6.zip if working with multiprotein inputs).
- For peptide-focused studies (peptide signatures/FASTA/PDB): use peptides_pdb.zip, sequence_signature.zip, and structural_signature.zip.
- For clustering and redundancy analysis: download clusters.zip and, if necessary, legacy files for historical comparison.
Some important considerations include file sizes and the number of entries specified on the Download page, which may be updated as new versions become available. Furthermore, when reusing the data, please respect the licenses and citations indicated in the “How to cite” section 1.3.
2.5 Explore Page
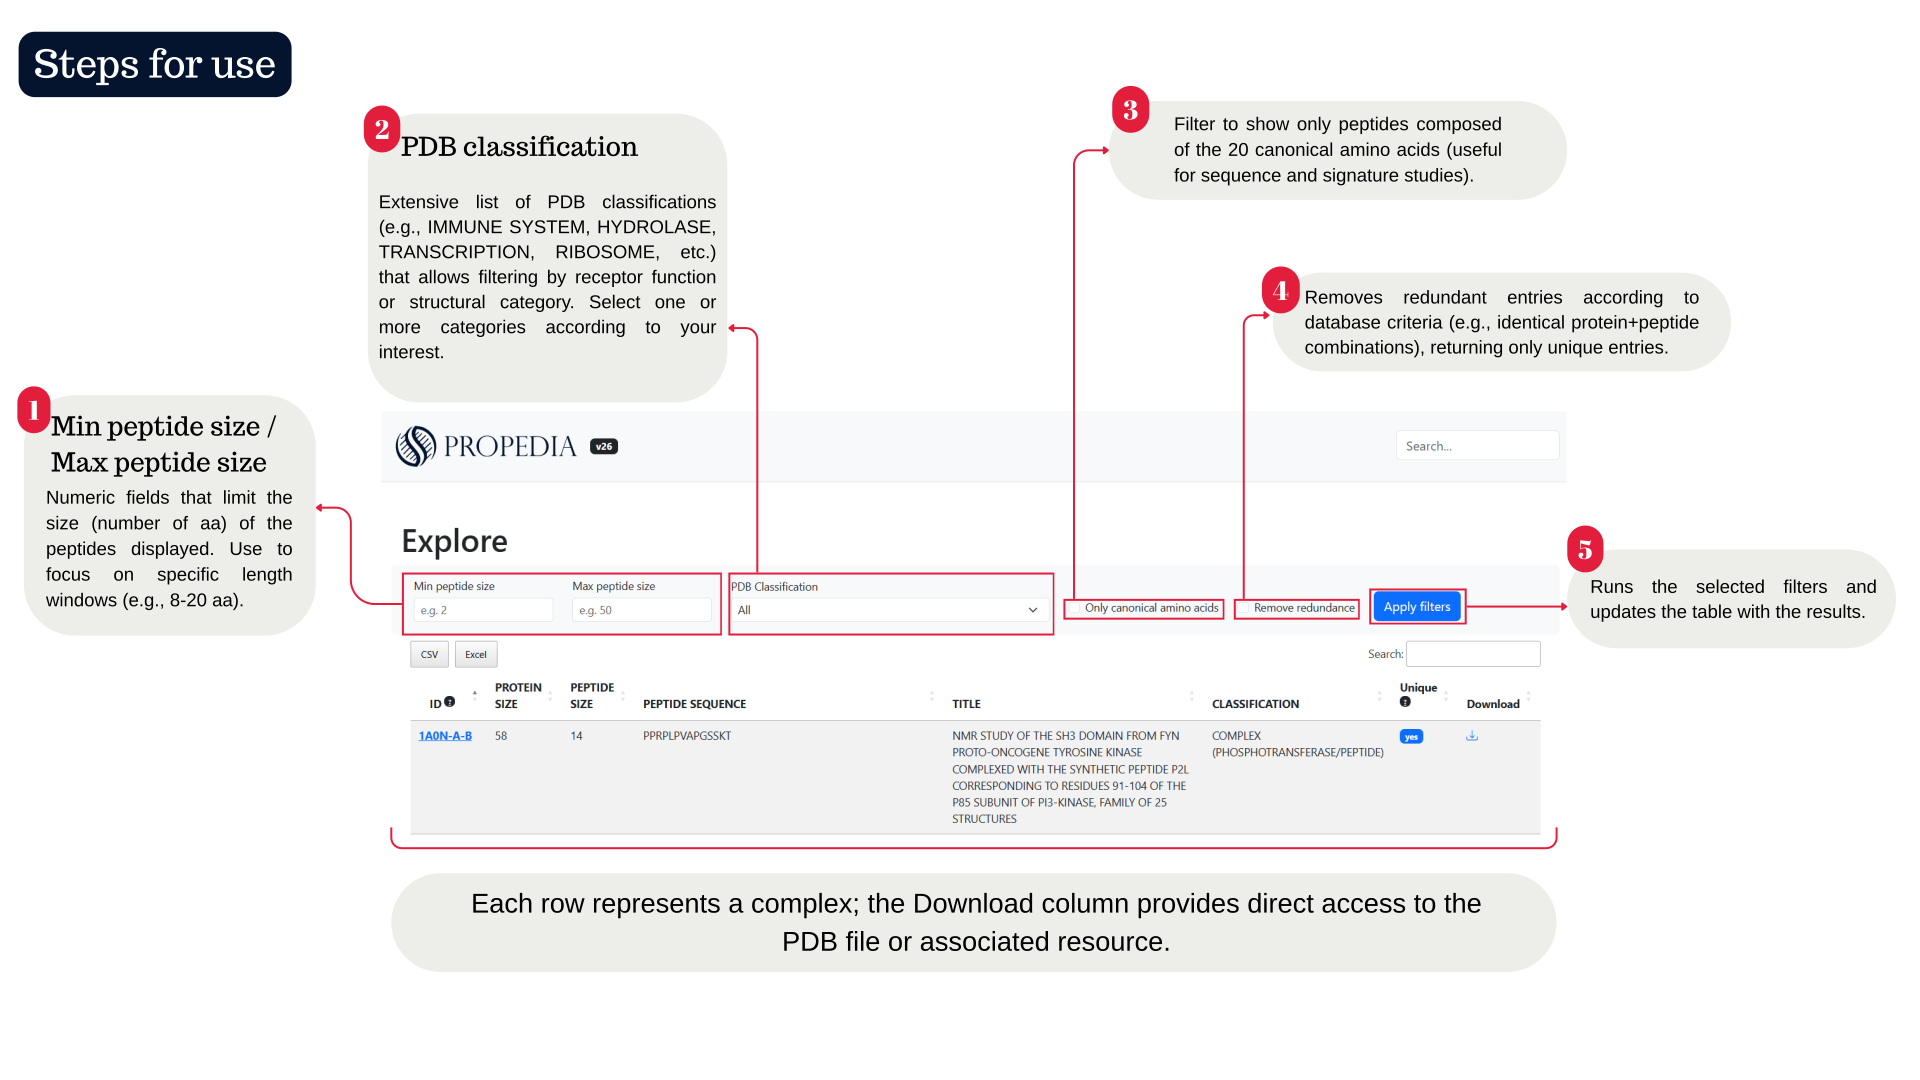
The Explore page is the main interface for browsing and filtering Propedia protein-peptide complexes. It brings together interactive filters, options to reduce redundancy, and a table of entries that allows quick inspection and direct download of associated files. A quick tutorial is illustrated in the figure below.
The Filter search panel combines selection fields and sliders. Every filter is optional: a field left on All, or a slider left at its neutral end (shown as any), does not restrict the results. The filters currently available are:
- Structural and functional description: PDB classification, Structure method, Canonical amino acids, Therapeutic class and the peptide length range (Min peptide size and Max peptide size).
- Interface and contacts: Interface evidence (the PISA reading described in section 2.1.5: strong, moderate or weak), Salt bridges, Min hydrogen bonds, Min buried area (Ų), Min buried peptide (%), Min hydrophobic (%) and Min positive residues.
- Quality and energy: Min resolution (Å), Min bind. free energy (the affinity predicted by PRODIGY) and Min ΔGdiss (the dissociation free energy estimated by PISA). The last two are predicted values and are marked with a warning sign on the page.
- Remove redundancy: keeps only the leader of each cluster of complexes with similar sequences (see section 2.3).
Filters are applied together, and take effect when you click Apply filters; Clear puts every field back to its neutral state. The counter above the panel reports how many complexes match the current selection.
2.5.1 Practical search examples, tips and best practices
In the table below, we list some examples for you to practice different ways of exploring in Propedia v26.
| Objectives | What to do |
|---|---|
| Find short antimicrobial peptides (2-10 aa) | Set Min = 2, Max = 10; select classifications related to ANTIMICROBIAL or ANTIBIOTIC; apply filters |
| Search for peptides that interact with transcription proteins | Filter by TRANSCRIPTION and then inspect sequences and interfaces on the detail pages |
| Extract non-redundant canonical set | Check Only canonical amino acids + Remove redundancy and export the list (via Individual download or using propedia_26.csv for batch processing) |
For large-scale analyses, we recommend downloading propedia_26.csv from the Downloads page and applying filters locally (pandas/R), it is faster and more reproducible. Use the Remove redundancy option before generating statistics to avoid bias from repeated entries. Combine filters (size + classification + canonicity) to reduce results and facilitate manual inspection. If you want to compare similar groups, use the Clusters tab after identifying relevant hits in Explore.
2.5.2 Troubleshooting
If no results are displayed after applying filters, check that the size range or combination of classifications is not too restrictive; if necessary, remove some filters and try again. If the list displayed is too long or the page appears slow, consider reducing the filters or using the local CSV file to perform the filtering, especially on slower connections where downloading individual PDB files may take time. If the download does not work, check the Download link corresponding to the selected row and, if the problem persists, use the Downloads section to obtain the files in batches. Finally, discrepancies observed in the “Unique?” field are expected, as this attribute reflects the internal methodology for removing redundancy, based on the concatenation of protein and peptide sequences,whose details and criteria can be found in the Clusters area or in the technical documentation.
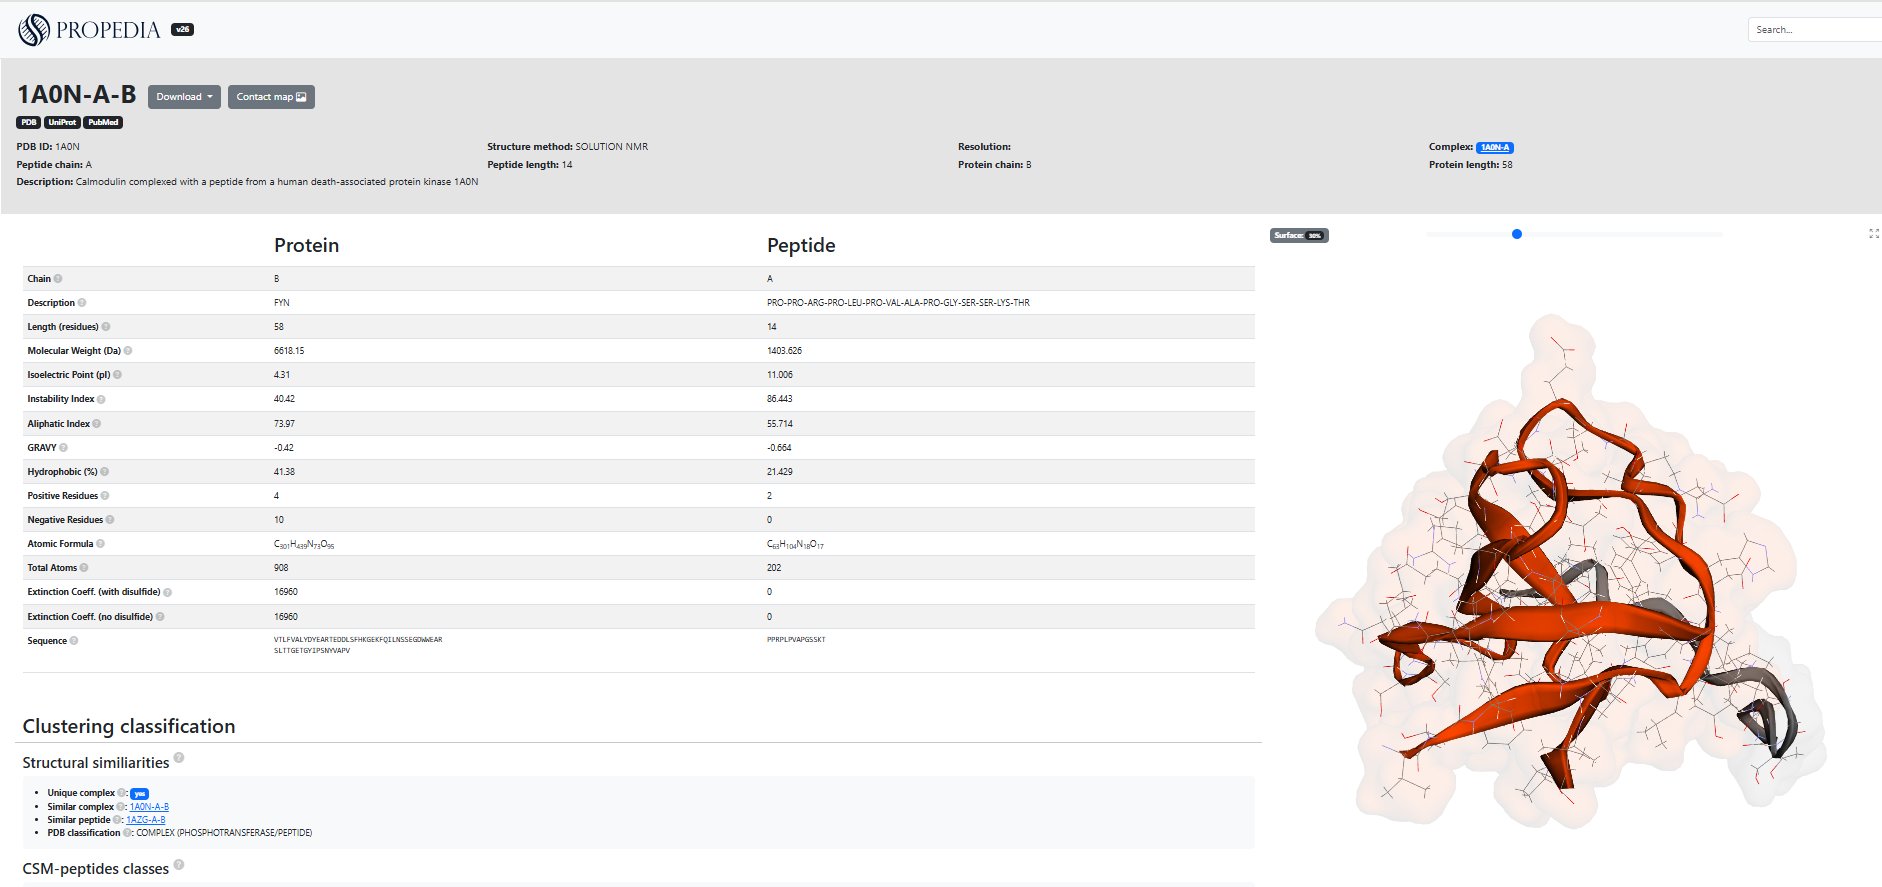
2.5.3 ID page: e.g.: 1A0N-A-B
The ID page (Figure 25) displays all available data and analyses for a specific protein-peptide complex: metadata (PDB, experimental method, description), sequences, calculated physicochemical properties, cluster classification, surface and energy metrics, atomic contact table, contact map, and 3D viewer. It also provides download links and shortcuts to external resources (RCSB PDB, UniProt, PubMed).
The header and metadata include the Identifier (ID), for example, 1A0N-A-B, which indicates the PDB code accompanied by the peptide and protein chains, as well as external links that provide direct access to the corresponding entries in RCSB PDB, UniProt, and PubMed. The structural method is also presented, containing the experimental technique used (such as SOLUTION NMR) and, when available, the resolution of the structure, as well as a concise description of the complex, such as in “Calmodulin complexed with a peptide...”. The page shows two columns (Protein/Peptide) with automatically calculated sequences and properties, for example: sequence (complete receptor chain and peptide sequence), length, molecular weight, isoelectric point (pI), instability index, aliphatic index, GRAVY, % Hydrophobicity, Residues + / -, atomic formula, total atoms and extinction coefficient. All of these properties are shown in Figure 25. These values are useful for rapid assessment of physicochemical properties and for filtering in pipelines.
2.5.3.1 How should it be interpreted?
In section 2.1, you saw the description of all items in the column that biochemically characterize the protein-peptide complex. The “Classification and Clusters” section presents information on structural similarities and the classification generated by clustering, indicating whether the complex is considered unique and listing other similar complexes or peptides identified by sequence, interface, or binding site grouping methods. It also includes CSM-peptides classes, which provide predictive scores for different functional categories, such as antibacterial, anticancer, or quorum sensing activities, accompanied by their respective confidence values. In practice, this section can be used to locate related complexes, for example, to identify alternative candidates that share the same binding site.
The protein-peptide interaction analysis section presents surface metrics calculated by Naccess, including the solvent-accessible area (ASA) for the complex, the protein, and the peptide, as well as interface-related parameters such as BProA, BPepA, BPP%, and BSA, which describe the contribution of each chain and the buried area in the interaction. For formal details on the formulas Naccess uses to calculate ASA and BSA, we recommend consulting its official documentation. The page also provides energy information generated by Prodigy, displaying the number of intermolecular contacts by type, the predicted affinity in kcal/mol, and the estimated Kd, although some fields may remain empty depending on the structure or availability of calculations. Complementing these analyses, the system lists the interface residues identified by COCaDA and presents a detailed contact table containing atomic or residual pairs, distances in angstroms, interaction type and class, such as hydrogen bonds (HB) or hydrophobic contacts (HY), with the possibility of filtering by backbone, side chain, or interaction category. In practice, it is recommended to observe contacts with a distance of less than 3.5 Å and marked as “HB” to identify potential hydrogen bonds, while “HY” interactions often indicate hydrophobic components relevant to affinity. The contact map should be analyzed in conjunction with the interactive 3D viewer on the page, which allows you to rotate the structure, inspect the interface, highlight residues present in the table, and save images configured from these views. These characteristics are illustrated in the figure below.
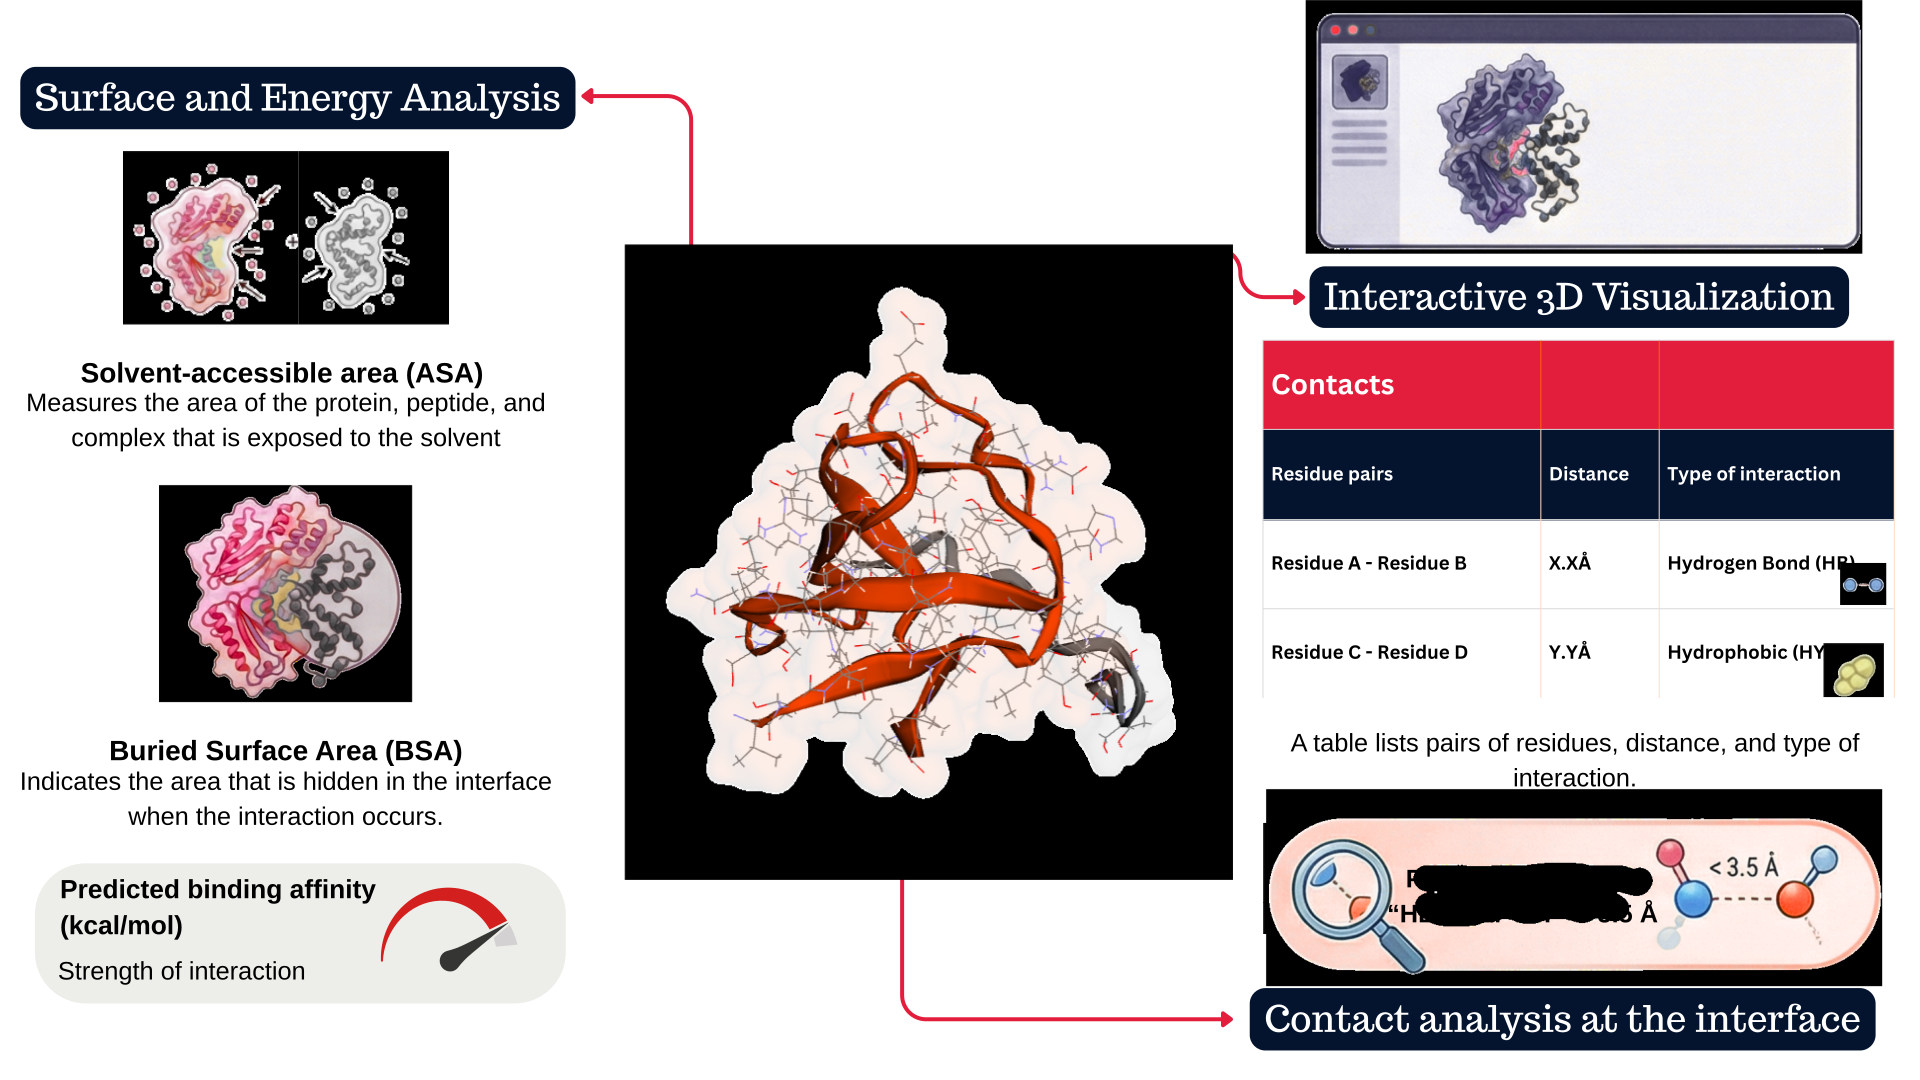
The Download / PDB file buttons in the header allow you to download the complex PDB (or open the entry in RCSB) and download any associated reports shown on the page.
2.5.3.2 Troubleshooting
Some energy fields or contact counts may appear empty. This can occur when the calculation failed or was not applicable to the input (e.g., NMR ensemble without a standard model). Check for the presence of expected atomic coordinates in the PDB.
Legends/abbreviations in the contact table may vary; if there is no explicit legend, use the website documentation or inspect the names to infer (HB → Hydrogen Bond, HY → Hydrophobic, etc.).
2.6 Search for Similar Binding Sites (ProBiS)
The Search for Similar Binding Sites tool allows you to identify binding sites that are structurally similar to the one you specify. This feature is handy for:
- Finding peptides that bind to equivalent regions in different proteins.
- Detecting functional structural conservation even among proteins with low sequence similarity.
- Exploring possible molecular recognition mechanisms in distant families.
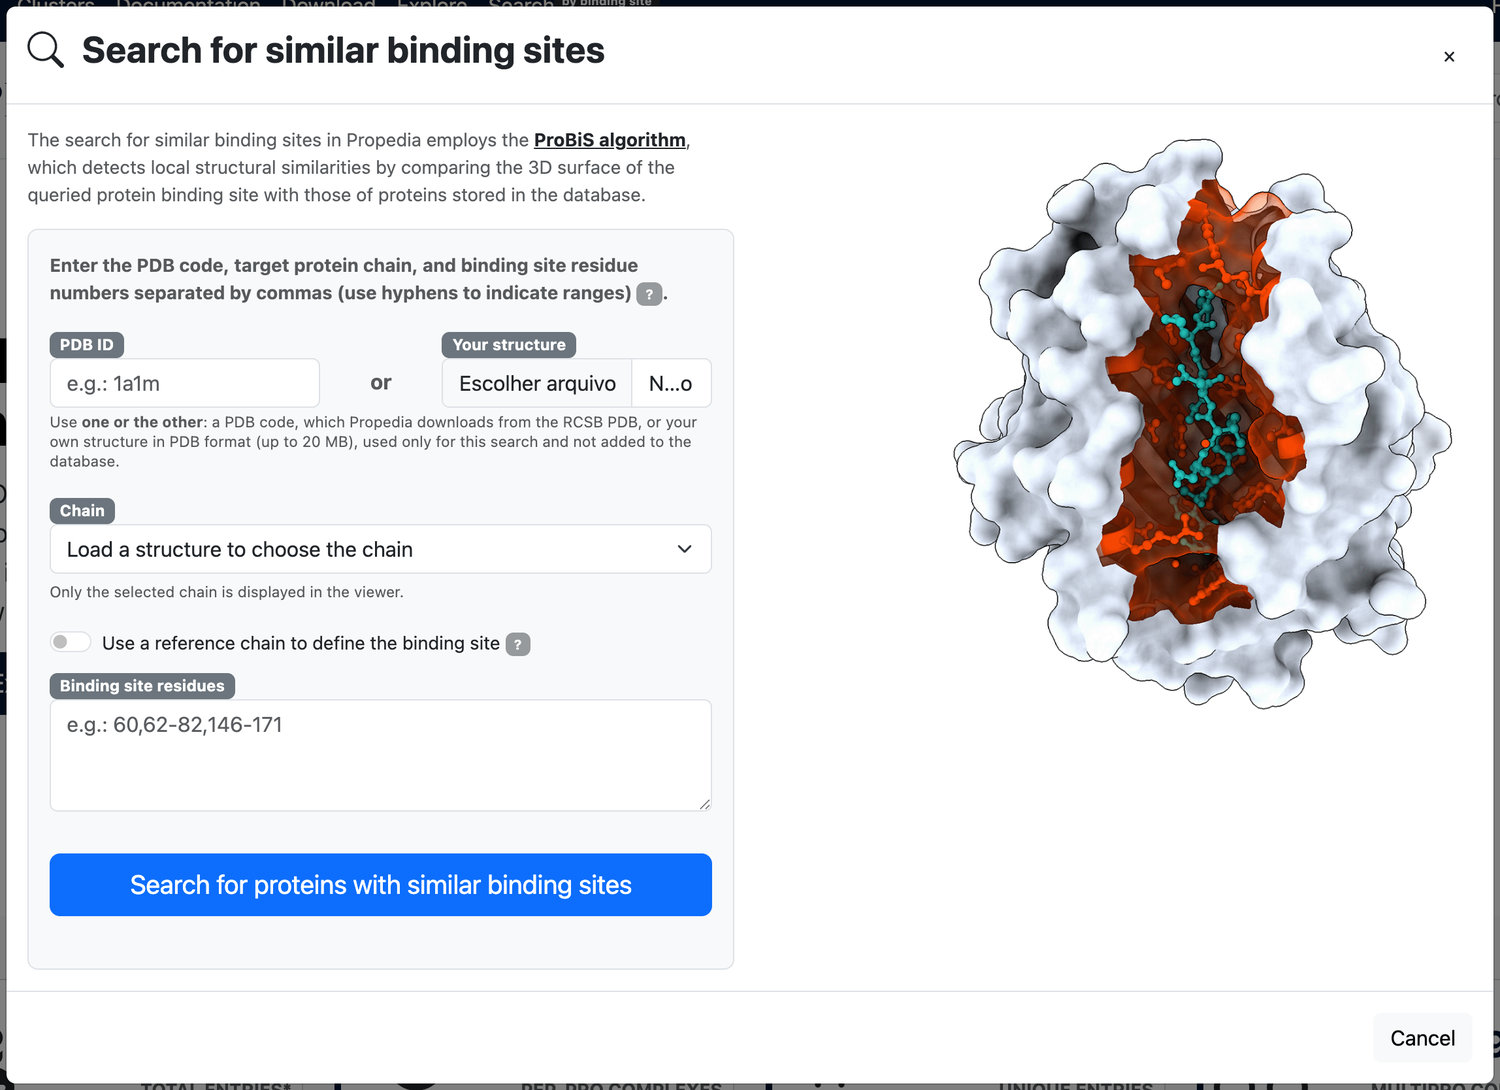
The search is based on the ProBiS (Protein Binding Sites) algorithm, which performs local structural alignment between protein surfaces. Unlike global methods, ProBiS searches for local 3D patterns of physicochemical properties, including geometry, functional groups, curvature, and electrostatic characteristics. A tutorial is shown in Figure 27.
2.6.1 What is new in version 26
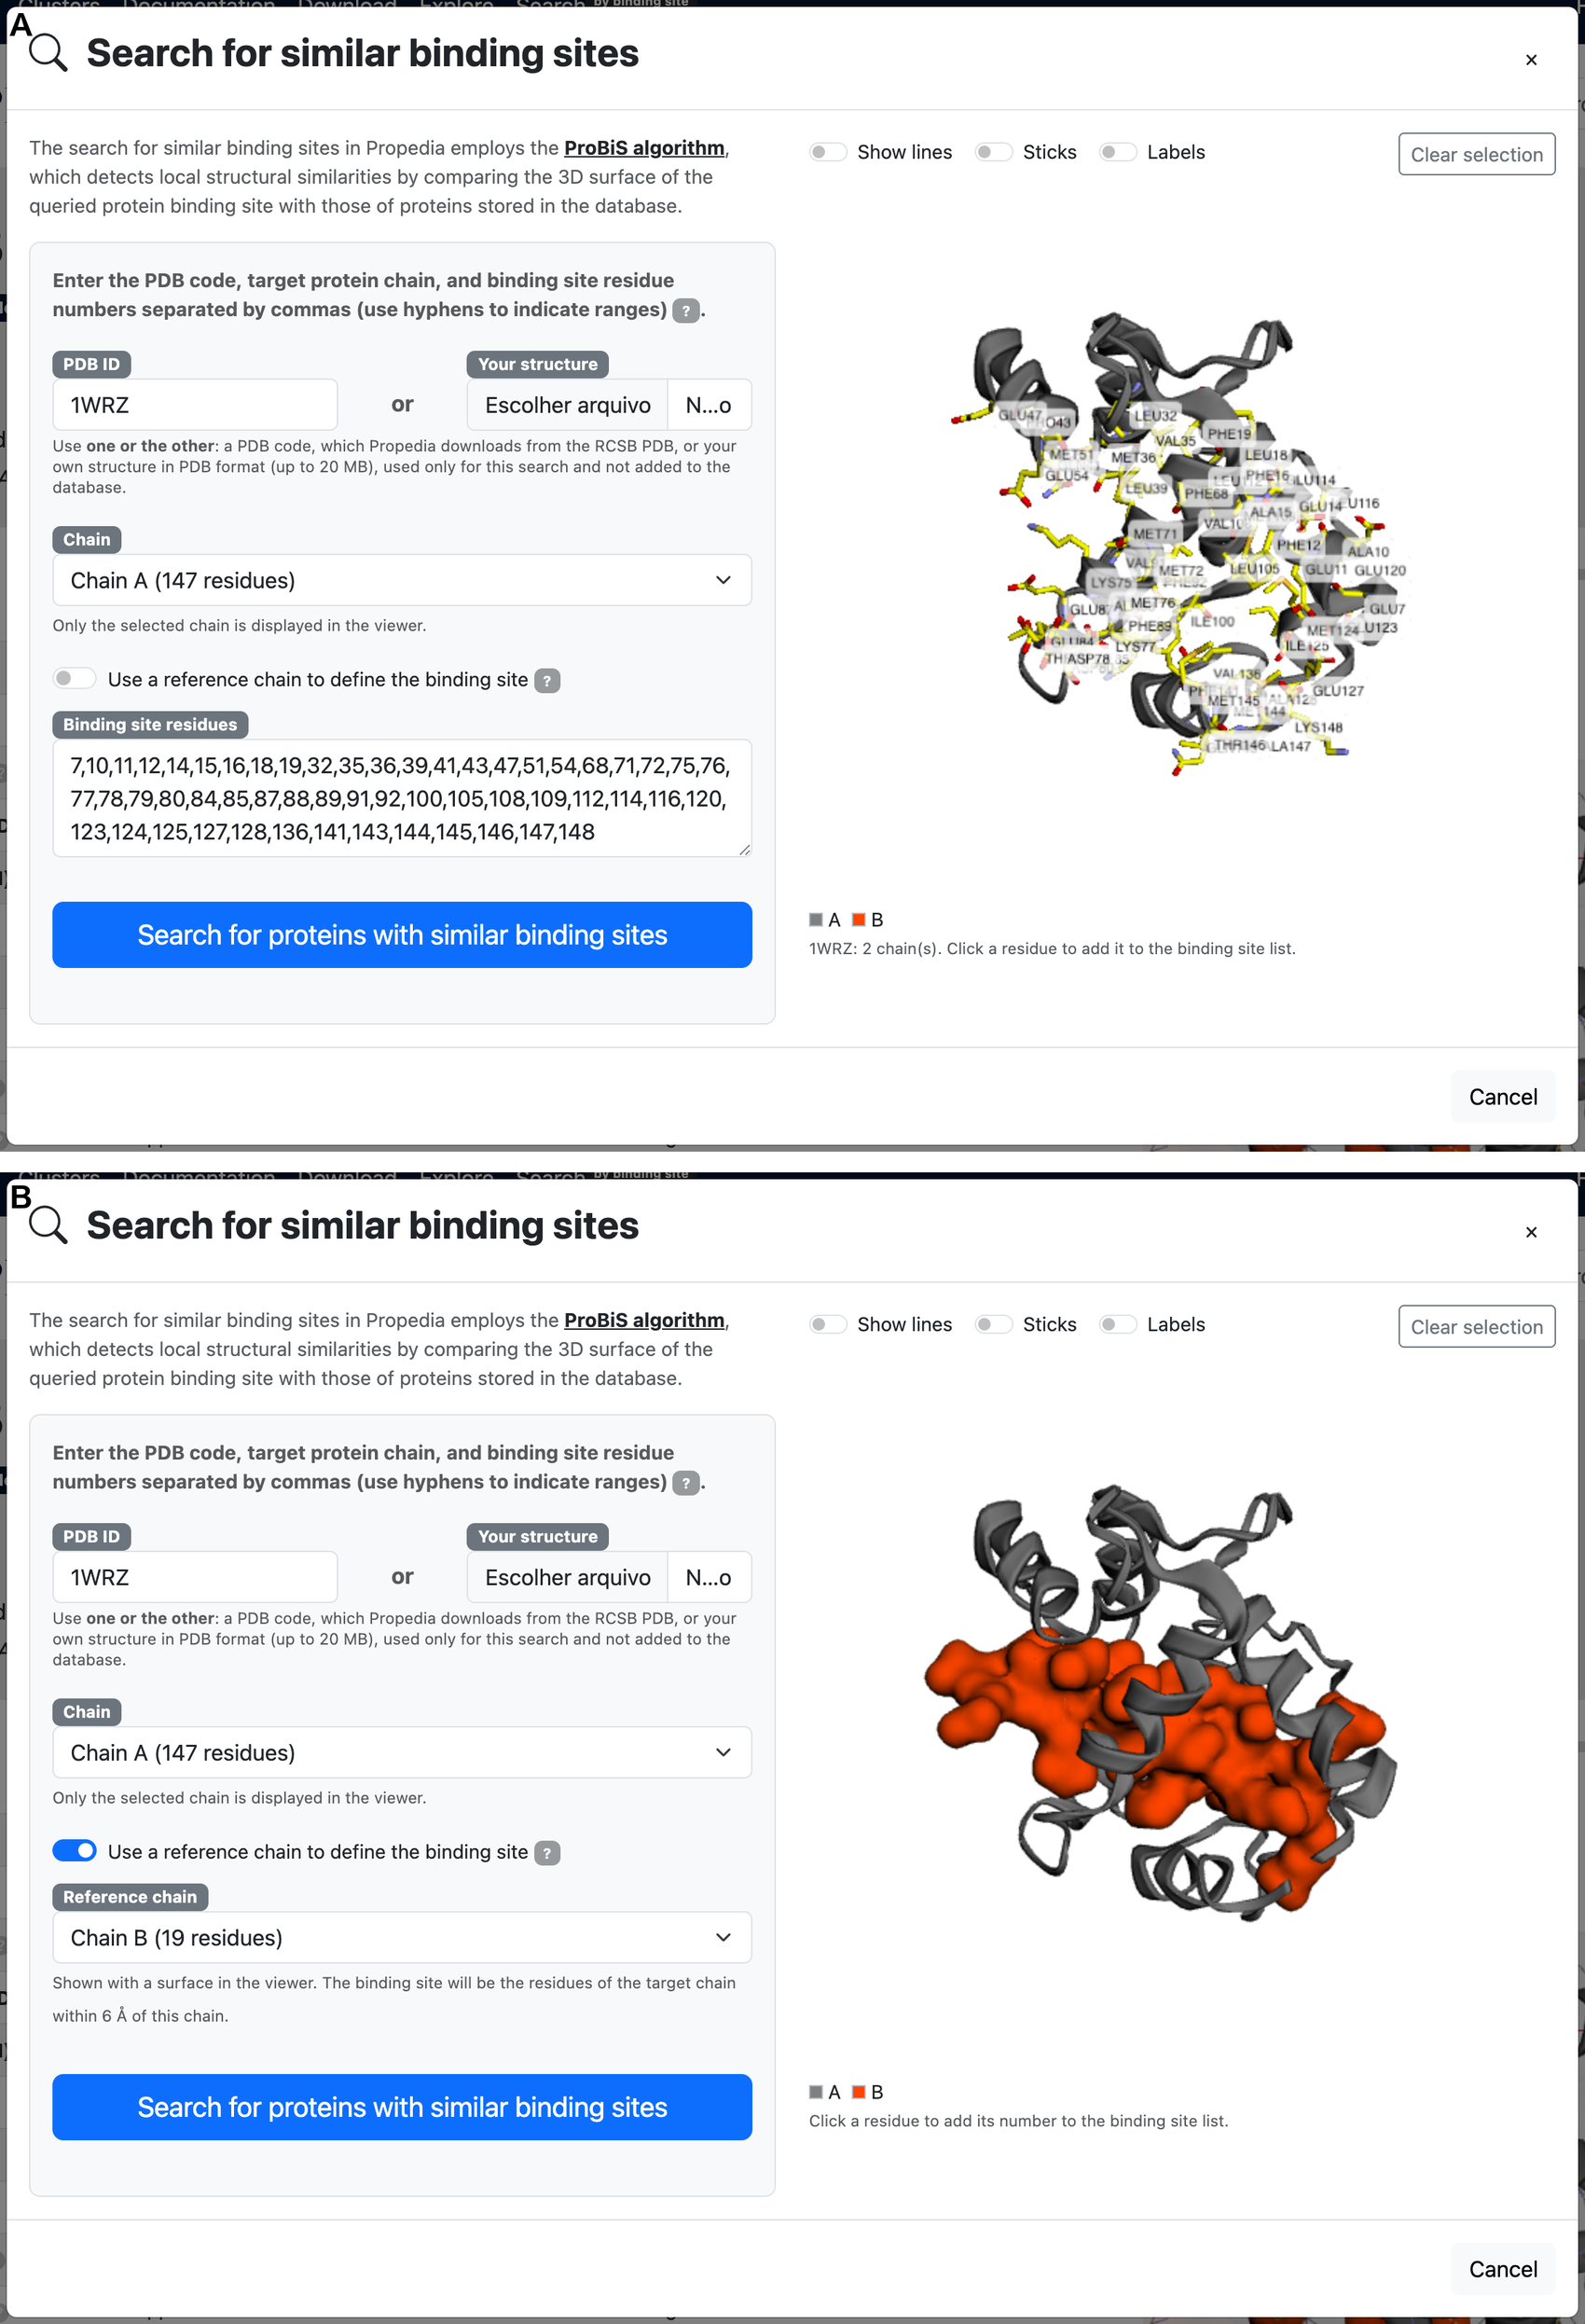
In version 26 the search stopped being a form that only accepts typed text. The structure is now loaded into the window itself, and everything the search needs — the chain and the residues of the binding site — can be taken from the structure instead of being written by hand.
- Reachable from an entry. The Find a similar binding site button on the page of a complex opens the search already filled in with the PDB code, the protein chain and the interface residues of that entry, so the site being queried is the one the user was looking at.
- Your own structure. Besides a PDB code, which Propedia downloads from the RCSB PDB, the user can upload a structure in PDB format (up to 20 MB). The file is used only for that search and is not added to the database.
- Asynchronous loading and list of chains. The structure is fetched in the background, without blocking the form. As soon as it is parsed, the Chain field becomes a list of the chains found in the file, each with the number of residues it contains, and only the selected chain is displayed in the viewer.
- Interactive viewer. The structure is shown in a 3D viewer, with one colour per chain. Clicking a residue adds its number to the binding site list and draws it as sticks with a label; clicking it again removes it. Switches control the display of lines, sticks and labels for the whole chain, and Clear selection empties the list.
- Reference chain. Instead of listing the residues, the user can point to a second chain — a peptide, for instance — as a reference. Propedia then takes the binding site to be the residues of the target chain within 6 Å of that chain, and the reference chain is drawn as a surface in the viewer.
This tool should be used to locate other experimental complexes in which the peptide interacts with equivalent sites, as well as to predict cross-reactivity, identifying peptides capable of binding to multiple proteins that have similar surfaces. It is also useful for exploring mutations, allowing the evaluation of whether structural changes at the site modify its similarity to already known sites, in addition to assisting in the identification of functional analogues in proteins that have not yet been characterized.
2.6.2 Example (ProBiS)
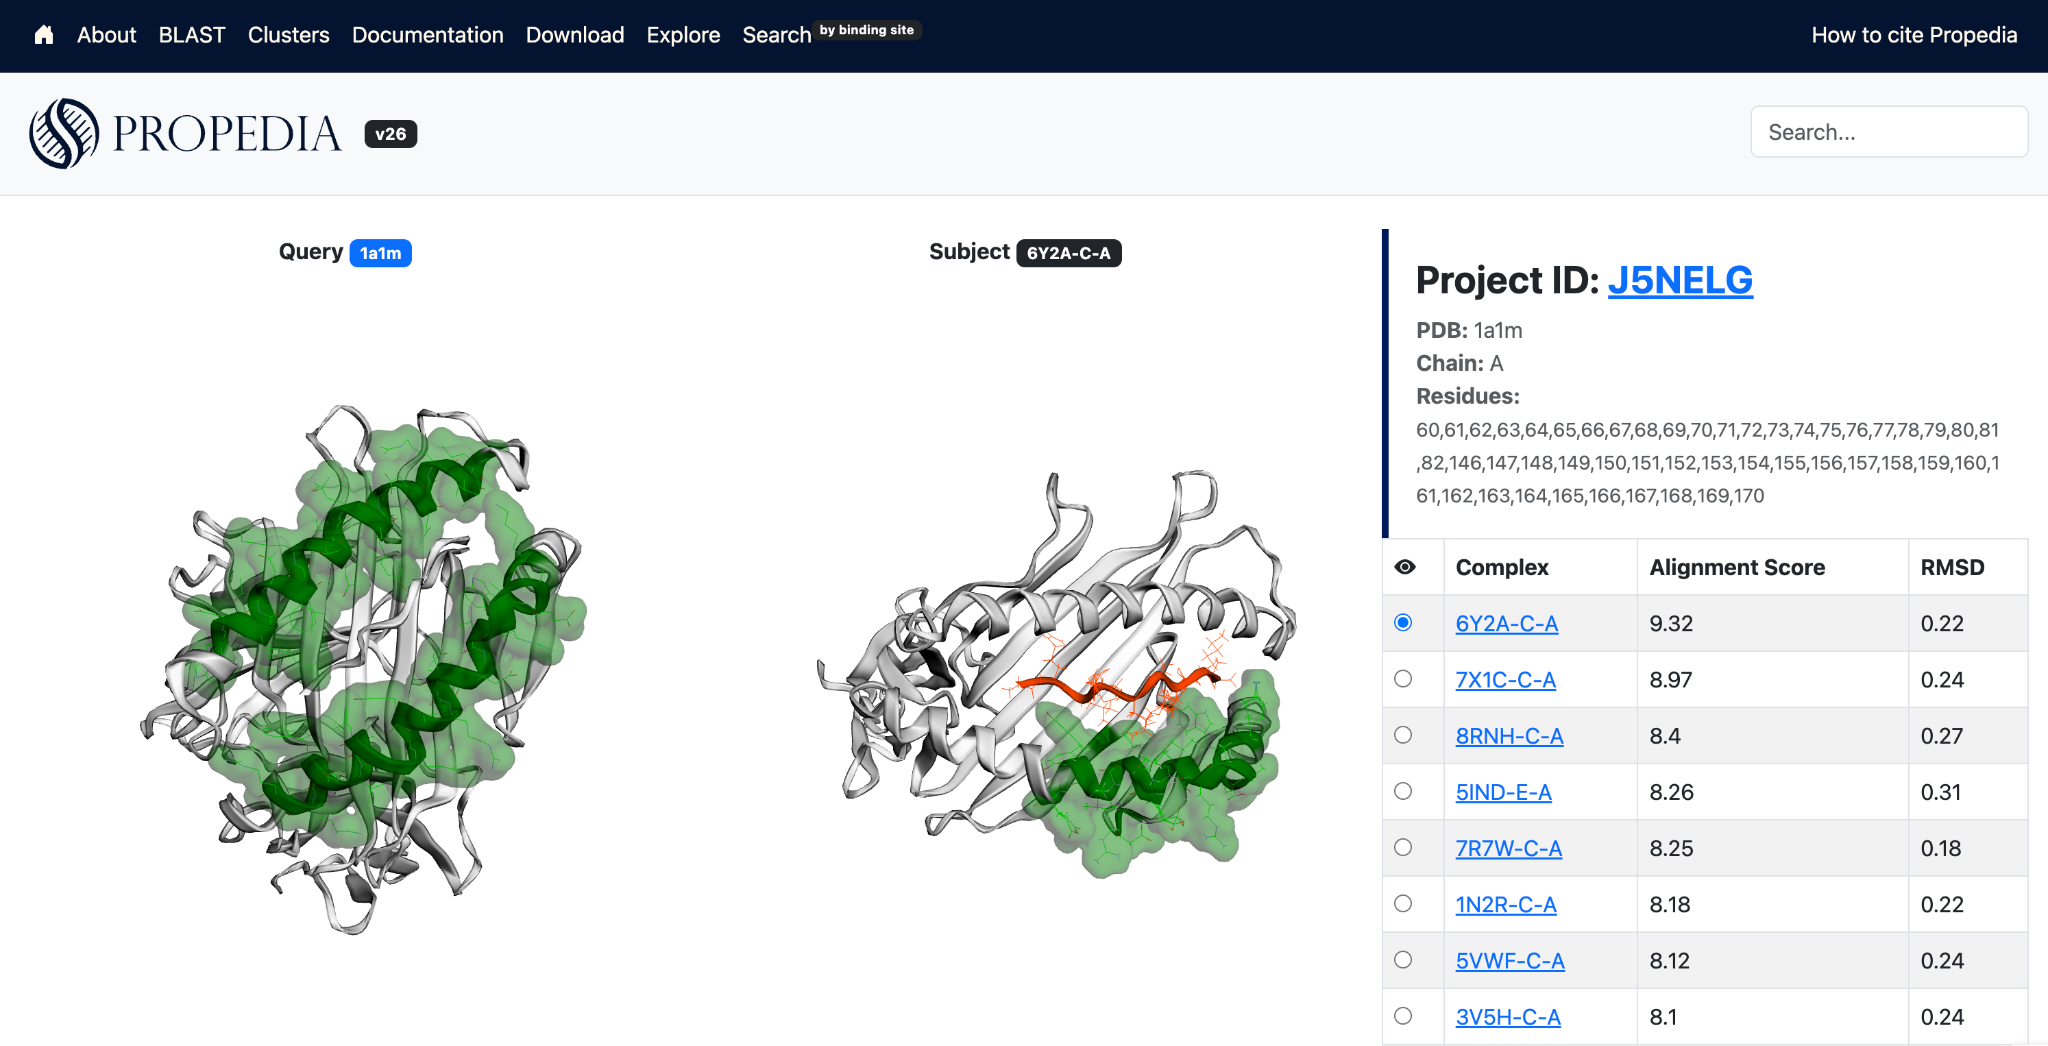
To perform a search for binding sites, click the option in the top menu. Enter the PDB ID used in the search, including the chain, and the residues that compose the desired binding site. The figure below shows an example for the 1a1m (chain A) structure and their binding site: 60,62-82,146-171.
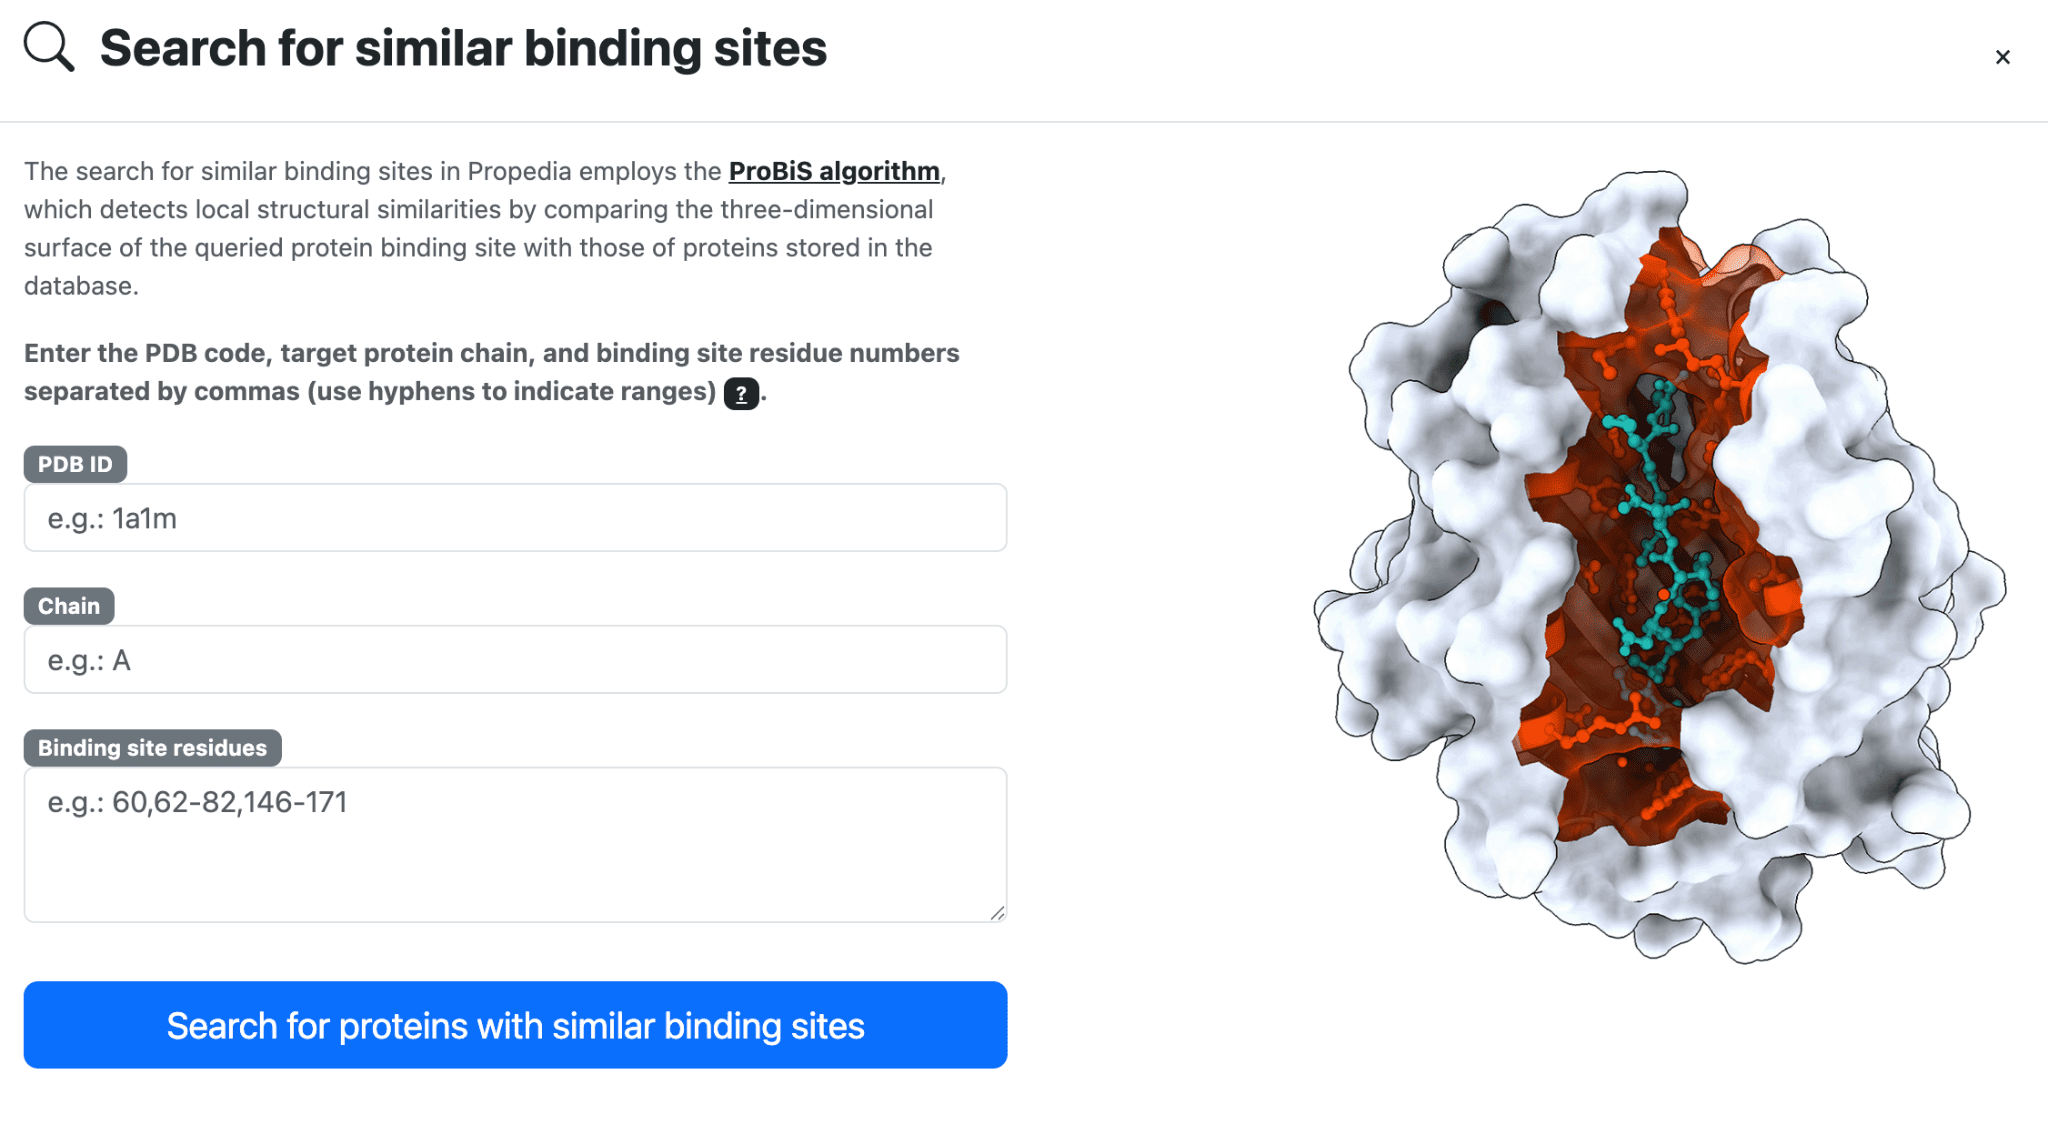
Wait for the result. Propedia uses the ProBis algorithm to perform parallelized searches (on average, searches take about 10 minutes).
At the end, Propedia returns a list of structures with similar binding sites. Note that similar regions are highlighted in green (the input is displayed on the left, and the result is displayed on the right). Click on the radio input fields to change the structure shown on the right.
3. Source code and reproducibility
Everything needed to inspect, reuse or rebuild Propedia is publicly available:
- The source code for the web tool is available at https://github.com/LBS-UFMG/propedia26.
- Full supplementary material is available at https://github.com/LBS-UFMG/propedia26-sm.
- The complete Python pipeline for reproducing Propedia is available at https://github.com/LBS-UFMG/propedia-pipeline.
4. Data descriptors
The CSV distributed on the Download page carries one row per complex and 94 columns, listed below in the order in which they appear in the file. The descriptions here are deliberately short; the full descriptor, with the complete definition of each field, is Supplementary Table S9 of the Propedia 26 paper and is also available in the supplementary material repository. Fields marked as predicted come from computational models, not from experiment, and the sections referenced in the text explain how each one is obtained: physicochemical properties in 2.1.2, therapeutic classes in 2.1.4, surface, energy and interface properties in 2.1.5, and clustering in 2.3.
| # | Column | Description | Type | Source |
|---|---|---|---|---|
| 0 | id |
PDB code followed by the peptide and the protein chain (e.g. 1A0N-A-B). | String (8) | Propedia 26 |
| 1 | AAP |
Probability that the peptide is anti-angiogenic (cutoff 0.9). Predicted. | Float | CSM-peptides |
| 2 | ABP |
Probability that the peptide is antibacterial (cutoff 0.9). Predicted. | Float | CSM-peptides |
| 3 | ACP |
Probability that the peptide is anticancer (cutoff 0.9). Predicted. | Float | CSM-peptides |
| 4 | AIP |
Probability that the peptide is anti-inflammatory (cutoff 0.9). Predicted. | Float | CSM-peptides |
| 5 | ASA_Complex |
Accessible surface area of the complex (Ų). | Float | NACCESS |
| 6 | ASA_Peptide |
Accessible surface area of the isolated peptide (Ų). | Float | NACCESS |
| 7 | ASA_Protein |
Accessible surface area of the isolated protein (Ų). | Float | NACCESS |
| 8 | BPP% |
Percentage of the peptide surface buried at the interface: 100 × BPepA / ASA_Peptide. | Int | NACCESS |
| 9 | BPepA |
Peptide area buried upon binding (Ų). | Int | NACCESS |
| 10 | BProA |
Protein area buried upon binding (Ų). | Int | NACCESS |
| 11 | BSA |
Buried surface area of the interface (Ų): (ASA_Protein + ASA_Peptide − ASA_Complex) / 2. | Int | NACCESS |
| 12 | CLASSIFICATION |
Classification of the entry as annotated in the PDB. | String | PDB |
| 13 | DEPOSITION_DATE |
Date the structure was deposited in the PDB (YYYY-MM-DD). | String | PDB |
| 14 | Interface Residues |
Residue numbers of the protein chain within 6 Å of the peptide, comma separated. | String | COCaDA |
| 15 | No. of apolar-apolar contacts |
Contacts between two apolar residues. | Int | PRODIGY |
| 16 | No. of apolar-polar contacts |
Contacts between an apolar and a polar residue. | Int | PRODIGY |
| 17 | No. of charged-apolar contacts |
Contacts between a charged and an apolar residue. | Int | PRODIGY |
| 18 | No. of charged-charged contacts |
Contacts between two charged residues. | Int | PRODIGY |
| 19 | No. of charged-polar contacts |
Contacts between a charged and a polar residue. | Int | PRODIGY |
| 20 | No. of intermolecular contacts |
Total protein-peptide contacts within 5.5 Å. | Int | PRODIGY |
| 21 | No. of polar-polar contacts |
Contacts between two polar residues. | Int | PRODIGY |
| 22 | PDB_ID |
PDB code of the structure. | String (4) | PDB |
| 23 | PEPTIDE_CHAIN |
Chain identifier of the peptide. | String (1) | PDB |
| 24 | PEPTIDE_DESC |
Name of the peptide chain as annotated in the PDB. | String | PDB |
| 25 | PEPTIDE_SEQ |
Peptide sequence in one-letter code. | String | PDB |
| 26 | PEPTIDE_SIZE |
Number of residues observed in the peptide chain. | Int | PDB |
| 27 | PROTEIN_CHAIN |
Chain identifier of the protein. | String (1) | PDB |
| 28 | PROTEIN_DESC |
Name of the protein chain as annotated in the PDB. | String | PDB |
| 29 | PROTEIN_SEQ |
Protein sequence in one-letter code. | String | PDB |
| 30 | PROTEIN_SIZE |
Number of residues observed in the protein chain. | String | PDB |
| 31 | Percentage of apolar NIS residues |
Apolar fraction of the non-interacting surface (%). | Float | PRODIGY |
| 32 | Percentage of charged NIS residues |
Charged fraction of the non-interacting surface (%). | Float | PRODIGY |
| 33 | Predicted binding affinity (kcal.mol-1) |
Free energy of binding ΔG (kcal/mol); the more negative, the stronger. Predicted. | Float | PRODIGY |
| 34 | Predicted dissociation constant (M) at 25.0˚C |
Dissociation constant Kd (M) at 25 °C. Predicted. | String | PRODIGY |
| 35 | QSP |
Probability that the peptide is quorum sensing (cutoff 0.9). Predicted. | Float | CSM-peptides |
| 36 | RESOLUTION |
Resolution of the structure (Å); empty for methods without resolution. | String | PDB |
| 37 | SBP |
Probability that the peptide is surface binding (cutoff 0.9). Predicted. | Float | CSM-peptides |
| 38 | STRUCTURE_METHOD |
Experimental method used to solve the structure. | String | PDB |
| 39 | TITLE |
Title of the PDB entry. | String | PDB |
| 40 | binding-cluster |
Cluster of structures with a similar binding site. | String | Propedia v1 |
| 41 | interface-cluster |
Cluster of structures with a similar interface. | String | Propedia v1 |
| 42 | is_leader |
yes when the complex is the representative of its sequence cluster. | String | Propedia 26 |
| 43 | leader_id |
Identifier of the representative of the cluster the complex belongs to. | String | Propedia 26 |
| 44 | organism |
Source organism of the structure. | String | PDB |
| 45 | peptide_AliphaticIndex |
Relative volume of the aliphatic side chains of the peptide. | Float | ProtParam |
| 46 | peptide_ExtCoeff_Disulfide |
Extinction coefficient of the peptide (M⁻¹ cm⁻¹) with cysteines paired. | Int | ProtParam |
| 47 | peptide_ExtCoeff_NoDisulfide |
Extinction coefficient of the peptide (M⁻¹ cm⁻¹) with cysteines reduced. | Int | ProtParam |
| 48 | peptide_Formula |
Atomic formula of the peptide. | String | ProtParam |
| 49 | peptide_GRAVY |
Average hydropathy of the peptide (Kyte-Doolittle); positive is hydrophobic. | Float | ProtParam |
| 50 | peptide_HydrophobicPercent |
Percentage of hydrophobic residues in the peptide. | Float | ProtParam |
| 51 | peptide_InstabilityIndex |
Estimated in vitro instability of the peptide; above 40 is unstable. | Float | ProtParam |
| 52 | peptide_MW |
Molecular weight of the peptide (Da). | Float | ProtParam |
| 53 | peptide_NegativeResidues |
Number of Asp and Glu residues in the peptide. | Int | ProtParam |
| 54 | peptide_PositiveResidues |
Number of Lys, Arg and His residues in the peptide. | Int | ProtParam |
| 55 | peptide_TotalAtoms |
Number of atoms in the peptide. | Int | ProtParam |
| 56 | peptide_pI |
Isoelectric point of the peptide. | Float | ProtParam |
| 57 | protein_AliphaticIndex |
Relative volume of the aliphatic side chains of the protein. | Float | ProtParam |
| 58 | protein_ExtCoeff_Disulfide |
Extinction coefficient of the protein (M⁻¹ cm⁻¹) with cysteines paired. | Int | ProtParam |
| 59 | protein_ExtCoeff_NoDisulfide |
Extinction coefficient of the protein (M⁻¹ cm⁻¹) with cysteines reduced. | Int | ProtParam |
| 60 | protein_Formula |
Atomic formula of the protein. | String | ProtParam |
| 61 | protein_GRAVY |
Average hydropathy of the protein (Kyte-Doolittle); positive is hydrophobic. | Float | ProtParam |
| 62 | protein_HydrophobicPercent |
Percentage of hydrophobic residues in the protein. | Float | ProtParam |
| 63 | protein_InstabilityIndex |
Estimated in vitro instability of the protein; above 40 is unstable. | Float | ProtParam |
| 64 | protein_MW |
Molecular weight of the protein (Da). | Float | ProtParam |
| 65 | protein_NegativeResidues |
Number of Asp and Glu residues in the protein. | Int | ProtParam |
| 66 | protein_PositiveResidues |
Number of Lys, Arg and His residues in the protein. | Int | ProtParam |
| 67 | protein_TotalAtoms |
Number of atoms in the protein. | Int | ProtParam |
| 68 | protein_pI |
Isoelectric point of the protein. | Float | ProtParam |
| 69 | seq100_clusters |
Identifier of the cluster of peptides with 100% sequence identity. | String | Propedia 26 |
| 70 | sequence-cluster |
Cluster of structures whose sequences have high identity. | String | Propedia v1 |
| 71 | PISA_status |
ok when PISA analysed the interface; otherwise the reason it did not. | String | PISA |
| 72 | PISA_chain_1 |
Chain PISA treated as the first partner (the peptide). | String (1) | PISA |
| 73 | PISA_chain_2 |
Chain PISA treated as the second partner (the protein). | String (1) | PISA |
| 74 | PISA_area |
Interface area, one face (Ų). | Int | PISA |
| 75 | PISA_solv_en |
Solvation energy gain ΔiG of the interface (kcal/mol). Predicted. | Float | PISA |
| 76 | PISA_pvalue |
Significance of ΔiG; below 0.5 the interface is more hydrophobic than by chance. | Float | PISA |
| 77 | PISA_n_hbonds |
Hydrogen bonds across the interface. | Int | PISA |
| 78 | PISA_n_saltbridges |
Salt bridges across the interface. | Int | PISA |
| 79 | PISA_nres_1 |
Peptide residues that take part in the interface. | Int | PISA |
| 80 | PISA_natoms_1 |
Peptide atoms that take part in the interface. | Int | PISA |
| 81 | PISA_area_1 |
Peptide area buried at the interface (Ų). | Int | PISA |
| 82 | PISA_solv_en_1 |
Contribution of the peptide to ΔiG (kcal/mol). Predicted. | Float | PISA |
| 83 | PISA_nres_2 |
Protein residues that take part in the interface. | Int | PISA |
| 84 | PISA_natoms_2 |
Protein atoms that take part in the interface. | Int | PISA |
| 85 | PISA_area_2 |
Protein area buried at the interface (Ų). | Int | PISA |
| 86 | PISA_solv_en_2 |
Contribution of the protein to ΔiG (kcal/mol). Predicted. | Float | PISA |
| 87 | PISA_diss_energy |
Dissociation free energy ΔGdiss (kcal/mol); positive means a stable complex. Predicted. | Float | PISA |
| 88 | PISA_entropy |
Entropic cost of the association TΔS (kcal/mol). Predicted. | Float | PISA |
| 89 | PISA_int_energy |
ΔiG summed over every interface of the structure (kcal/mol). Predicted. | Float | PISA |
| 90 | PISA_asa |
Accessible surface area of the complex (Ų). | Int | PISA |
| 91 | PISA_bsa |
Total area buried by the association, both faces (Ų). | Int | PISA |
| 92 | PISA_diss_area |
Interface area broken on dissociation (Ų). | Int | PISA |
| 93 | PISA_CSS |
Complexation Significance Score, 0 to 1; read as the interface evidence. | Float | PISA |
The multipro dataset is distributed as a separate file with a header of its own (64 columns). It shares the structural, physicochemical, surface, contact and energy columns described above and adds the cluster identifier and the complexes that belong to it, but it does not carry the therapeutic classes, the clustering columns or the interface properties calculated with PISA.
5. Final Considerations
This documentation presented the structure, functionalities, and usage flows of Propedia v26, including navigation, data models, structural analyses, algorithms employed, and search methods by interaction and binding sites.
As a database dedicated to protein-peptide complexes, Propedia remains in active development, maintaining its commitment to transparency, reproducibility, and continuous updating. We hope that this tool will provide solid support for research in structural bioinformatics, peptide design, biomolecular interaction mining, and the development of computational methods.
For questions, suggestions, or feature requests, users can contact the team at the address listed on the project's official website.
We appreciate your use of the platform and hope that Propedia will contribute significantly to the advancement of your research.
6. References
ALTSCHUL, S. F., GISH, W., MILLER, W., MYERS, E. W. & LIPMAN, D. J. Basic local alignment search tool. J. Mol. Biol. v. 215, p. 403-410, 1990.
BANK, Protein Data. Protein data bank. Nature New Biol, v. 233, n. 223, p. 10-1038, 1971.
BERMAN, Helen M., et al. “The protein data bank.” Biological Crystallography 58.6 (2002): 899–907.
BLAST Search Parameters - BlastTopics 0.1.1 documentation. Disponível em: <https://blast.ncbi.nlm.nih.gov/doc/blast-topics/blastsearchparams.html#word-size>.
CAMACHO, C. et al. BLAST+: architecture and applications. BMC Bioinformatics. v. 10, p. 421, 2009.
FASSLER, J.; COOPER, P. BLAST Glossary. Disponível em: <https://www.ncbi.nlm.nih.gov/books/NBK62051/>.
GASTEIGER, E. et al. Protein identification and analysis tools on the ExPASy server. In: The proteomics protocols handbook, p. 571–607 (Springer, 2005).
HUBBARD, S. J.; THORNTON, J. M. (1993). "NACCESS", Computer Program, Department of Biochemistry and Molecular Biology, University College London.
KRISSINEL, E.; HENRICK, K. “Inference of macromolecular assemblies from crystalline state.” Journal of Molecular Biology 372.3 (2007): 774–797.
LEMOS, Rafael Pereira, et al. “COCαDA - A fast and scalable algorithm for interatomic contact detection in proteins using Cα distance matrices.” Frontiers in Bioinformatics 5 (2025): 1630078.
LEMOS, Rafael P., et al. “Cocαda - large-scale protein interatomic contact cutoff optimization by Cα distance matrices.” Simpósio Brasileiro de Bioinformática (BSB). SBC, 2024.
MARIANO, D. C. B.; BARROSO, J. R. P. M.; CORREIA, T. S.; DE MELO-MINARDI, R. C. Introdução à Programação para Bioinformática com Biopython. 3. ed. North Charleston, SC (EUA): CreateSpace Independent Publishing Platform, v. 1. 230 p. 2015.
Table C3: [blastp application options. The blastp...]. Disponível em: <https://www.ncbi.nlm.nih.gov/books/NBK279684/table/appendices.T.blastp_application_options/>.
WHEELER, D.; BHAGWAT, M. BLAST QuickStart. Disponível em: <https://www.ncbi.nlm.nih.gov/books/NBK1734/>.
XUE, Li C., et al. “PRODIGY: a web server for predicting the binding affinity of protein–protein complexes.” Bioinformatics 32.23 (2016): 3676–3678.