VTR
How to use VTR
A fast tutorial for new users
How to use
For VTR simply usage, just upload two protein PDB files and click "Run". The other fields have default values, explained below.Link for paper executions: Myoglobin and hemoglobin | Receptor recognition by SARS-CoV-2 and SARS-CoV | Glucose-tolerant β-glucosidases
Input Data
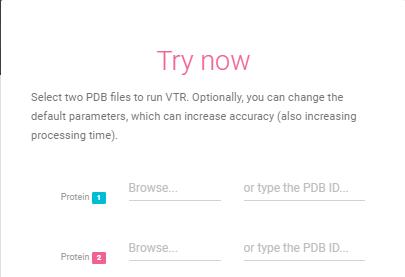
First and Second Proteins
The input files are two PDB protein files that must be uploaded by the user. You can just tip the PDB ids too.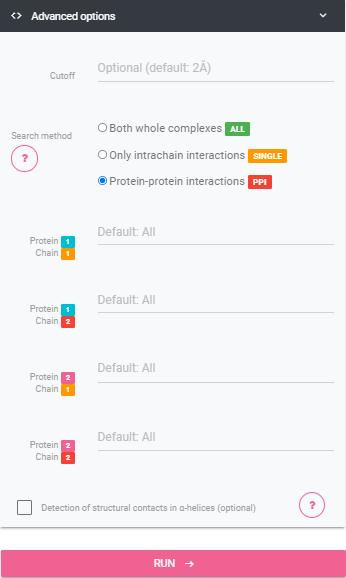
Cutoff
Maximum AVD between two Contact Vectors, the default value is 2 Å.Search Method
The method that defines how the chains will be filtered. Both whole complexes: Default execution, run VTR over all chains of the complexes Only intrachain interactions: Choose a single chain for each complex and calculate and compare just contacts within this chain. Protein-protein interactions: Select a pair of protein chains for each input. See belowProtein Chains
The Chains of the proteins that will be involved in the contacts calculation, write the chain name exactly like the PDB file (capital letter and only one letter). Selecting a chain, in general, improves the program speed.Include Main Chain Interactions
Detection of structural contacts in α-helices ON: include contacts among main-chain atoms of closer residues - allows lower than four positions distance (increase the number of results highly).Force alignment BETA
Remove chains not used from the PDB file. Check this only if you already tried to run VTR with this files, and the alignment got bad.Output Info
Resume
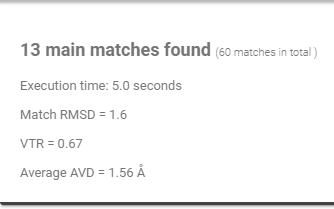
Provides useful information about the program execution and output, the match time is measured in seconds.
Parameters
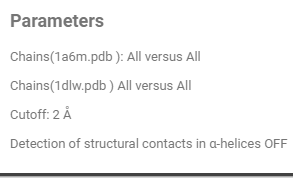
Feedback of the match settings.
Contact table
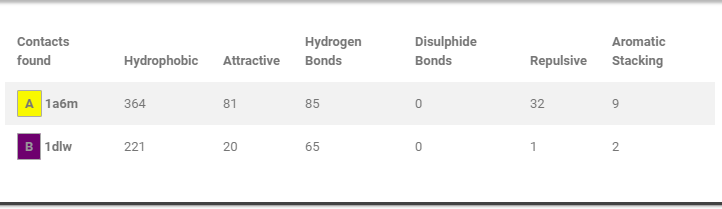
How many contacts of each type were found in each protein.
Match View
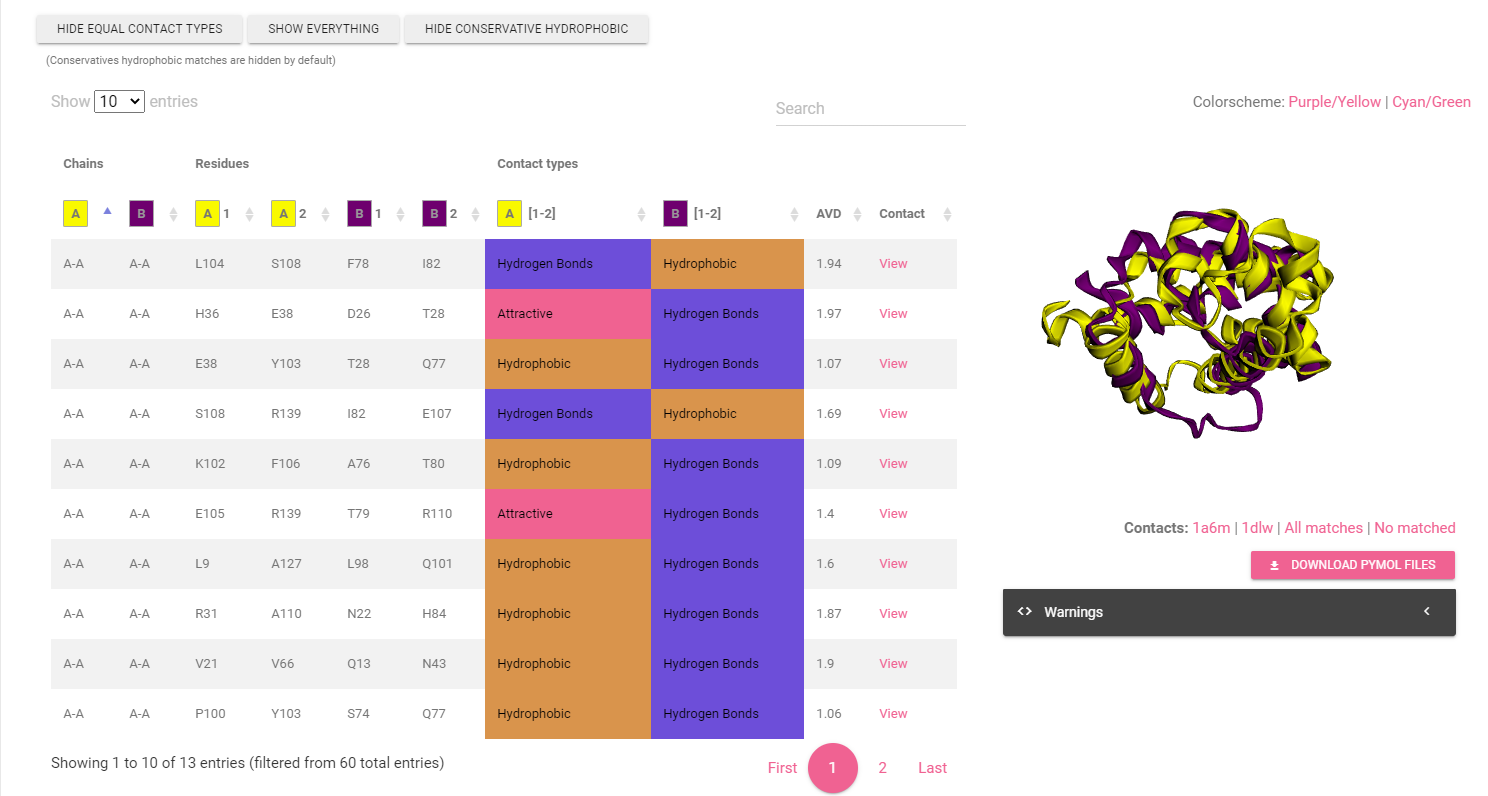
Provides a view in 3D mol of each match founded by the program, the table can be sorted in different ways.
Other Files
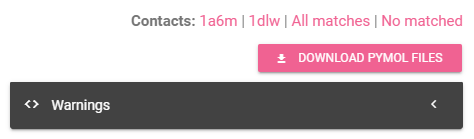
This section provide a list for the contacts founded in each protein, a list for the matches founded, and a list for the contacts that not mached(Dismatches), the Download button provide a ZIP file that contains a lot of PyMol scripts to view each contact in the PyMol, the file c_scale show all the matches(blue to red) and dismatches(gray) in the same figure, the highest the AVD, more blue is the contact edge.
Contact Maps
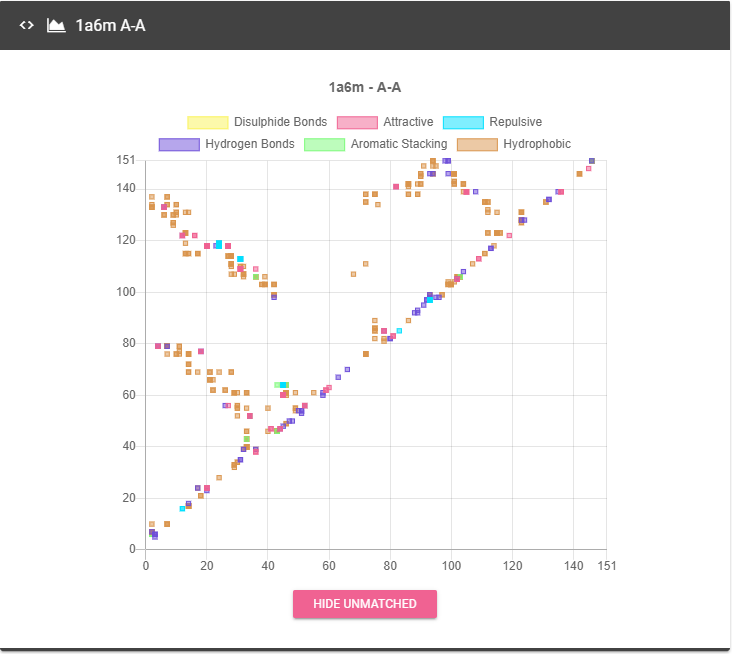
Contact Maps that represents contacts of each type of chain interaction, pass the cursor over any point of the graph will show all the contacts in that point, and the number of the residues involved in the contact, the colors represents the contacts types.
Contact Frequency Histograms
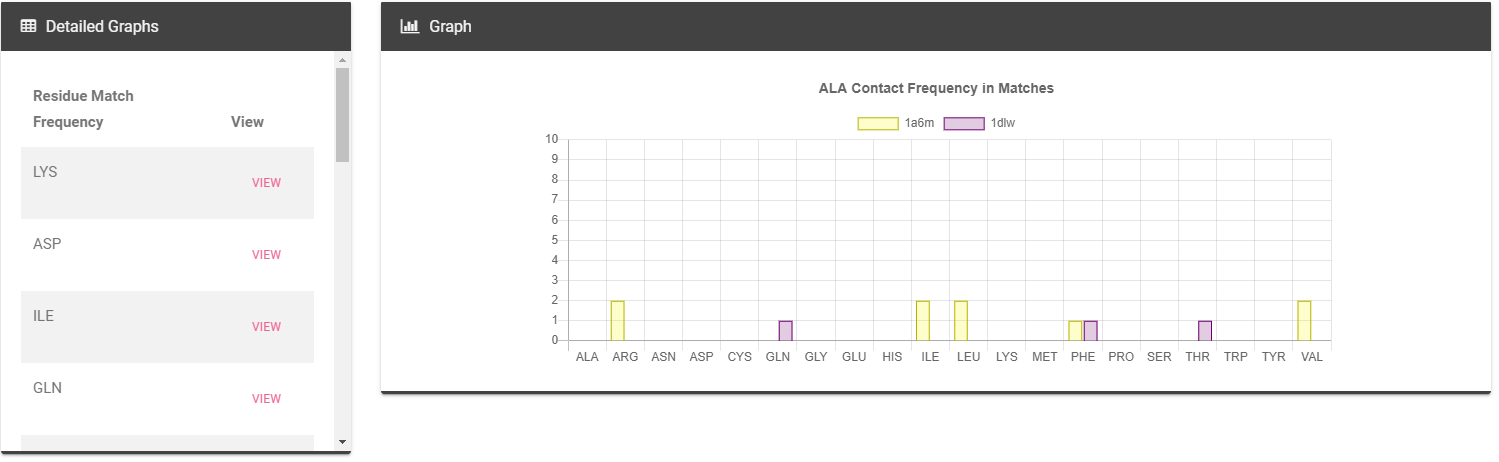
Histograms of match contacts frequency for each residue.